• Attention Forex Brokers, FX Companies & Hedge Funds.
    forum.forex is available for Acquisition
    Enquire

GBPUSD Daily Analysis

FXGlory Ltd

Well-known member
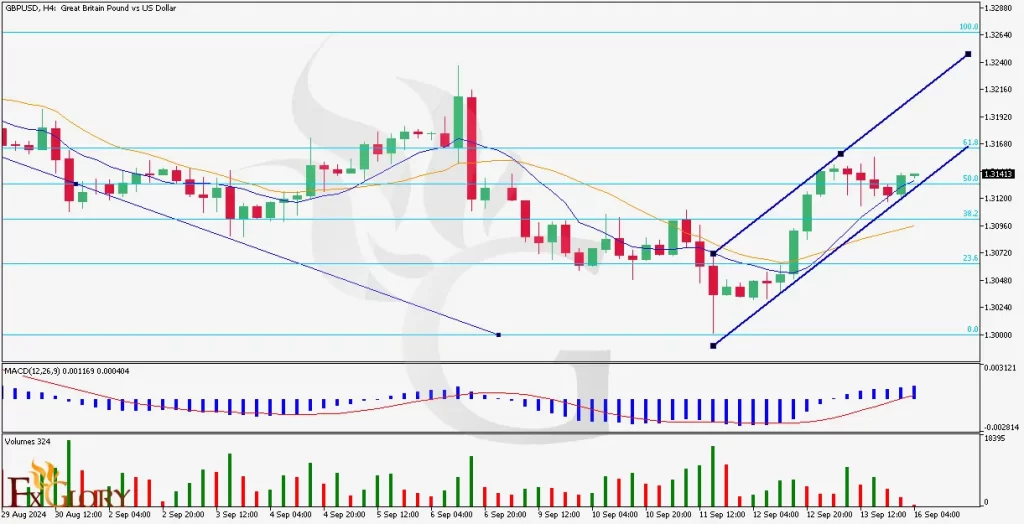
GBPUSD H4 Technical and Fundamental Analysis for 06.06.2024


GBPUSD_H4_Daily_Technical_and_Fundamentan_Analysis_for_06_06_2024.jpg


Time Zone: GMT +3
Time Frame: 4 Hours (H4)


Fundamental Analysis:


The GBPUSD forecast today reflects the relationship between the British Pound (GBP) and the US Dollar (USD). Fundamental factors influencing the GBPUSD pair include interest rate differentials, economic growth, and geopolitical stability. For the GBP, upcoming Construction PMI data is expected to impact market sentiment, with a forecast of 52.5 indicating expansion. For the USD, high-impact Unemployment Claims data, with a forecast of 220K, will be closely watched as it provides insights into the labor market, influencing the USD's strength.


Price Action:

On the H4 timeframe, the GBPUSD pair shows a steady uptrend, characterized by higher highs and higher lows. The GBPUSD price forecast today indicates a potential bullish continuation if the pair breaks above the immediate resistance levels. The market has recently tested significant resistance near 1.2836, suggesting a possible consolidation before further upward movement.


Key Technical Indicators:

Ichimoku Cloud:


The price is above the Ichimoku Cloud, indicating a bullish trend. The leading span lines (Senkou Span A and B) are widening, reinforcing the bullish sentiment.

The Tenkan-sen (red line) and Kijun-sen (blue line) are bullishly aligned, with the Tenkan-sen above the Kijun-sen.

Volume:

The recent increase in volume suggests strong buying interest, supporting the bullish momentum. Volume spikes coincide with upward price movements, confirming the validity of the uptrend.

RSI (Relative Strength Index):

The RSI is at 58.32, which is moderately bullish. This indicates that there is room for further upward movement before reaching overbought conditions (above 70).


Support and Resistance:

Support Levels:


The nearest support level is at 1.2763, followed by stronger support at 1.2703.

Resistance Levels:

Immediate resistance is at 1.2788, with a more significant resistance at 1.2836.


Conclusion and Consideration:

The GBPUSD trend predictions suggest a continuation of the bullish trend, supported by positive technical indicators and robust price action. Traders should monitor key resistance levels at 1.2788 and 1.2836 for potential breakout opportunities. As per the GBPUSD news analysis today, given the upcoming GBP Construction PMI and USD Unemployment Claims data, market volatility is expected. Proper risk management, including setting stop-loss levels, is crucial in navigating the current market conditions.


Disclaimer: The provided analysis is for informational purposes only and does not constitute investment advice. Traders should conduct their own research and analysis before making any trading decisions.


FxGlory
06.06.2024


image_2024-02-15_07_27_41.gif
 
GBPUSD Price Analysis for 12.06.2024


GBPUSD-H4-candelstick-chart.jpg


Time Zone: GMT +2
Time Frame: 4 Hours (H4)


Fundamental Analysis:


The recent news includes key economic indicators from the US that could significantly affect the possible future direction on GBP/USD exchange rate. On June 12th, critical data releases include the Core CPI m/m with a forecast of 0.3% against the previous 0.3%, and the CPI m/m expected at 0.1% compared to the previous 0.3%. The year-over-year CPI is anticipated to be 3.4%, matching the previous figure. Additionally, at 7:00 pm, the Federal Funds Rate is expected to remain at 5.50%, accompanied by the FOMC Economic Projections, FOMC Statement, and the Federal Budget Balance, forecasted at -279.6B against the previous 209.5B. These economic indicators are essential to watch as they provide insights into the economic health of the US, influencing the strength of the USD and, consequently, the GBP/USD currency pair.


Price Action:

The GBP/USD H4 chart currently shows that the price is testing a significant resistance level. GBPUSD candlestick formations around this resistance zone indicate a potential weakness in the bearish momentum on this pair's price movement, suggesting a possible reversal or consolidation. Traders should watch for confirmation of this resistance holding or breaking to determine the next directional move.


Key Technical Indicators:

Williams R%:
The Williams % Range on GBPUSD is currently showing bearish conditions, hovering in the oversold territory. This suggests that the pair might be due for a pullback or consolidation before any further bearish movement.

MACD: The Moving Average Convergence Divergence (MACD) on this forex pair shows bearish signals with the histogram below the zero line and the MACD line below the signal line, indicating ongoing bearish momentum.


Support and Resistance Levels:

Support:
The lower points of the recent candles around 1.27650 serve as the immediate support level.

Resistance: The upper line of the former bearish channel around 1.26870 acts as a resistance level.

Conclusion: Traders should closely monitor both the upcoming economic news and the GBP/USD reaction at the 1.27640 resistance level. A failure to break through could confirm the bearish price prediction, leading to potential short opportunities. Conversely, a strong push above this level could invalidate the bearish scenario for this pair. Given these dynamics, it's essential to stay updated with the latest economic reports and adjust strategies accordingly to navigate the volatile forex market effectively.


Disclaimer:
This analysis is for informational purposes only and does not constitute investment advice. Traders should conduct their own research and analysis before making any trading decisions.


FxGlory
12.06.2024


image_2024-02-15_07_27_41.gif
 
GBPUSD H4 Technical and Fundamental Analysis for 20.06.2024


GBPUSD_H4_Chart_Daily_Technical_and_Fundamental_Analysis_for_20.jpg


Time Zone: GMT +3
Time Frame: 4 Hours (H4)


Fundamental Analysis:


The GBP/USD news analysis today is influenced by a variety of fundamental factors including economic indicators from both the UK and the US. Upcoming key events include the Bank of England's Monetary Policy Committee meeting minutes and US unemployment claims. The BOE's stance on interest rates and the MPC's vote distribution will provide insight into future monetary policy, which is crucial for currency valuation. In the US, unemployment claims are expected to be around 235K, with lower actual figures generally being positive for the USD. Additionally, housing data and manufacturing indices from the US will provide further economic context that can impact the pair.


Price Action:

The GBP/USD H4 chart shows a recent bullish trend within a rising channel, with prices attempting to break above the resistance level at 1.27391. The GBP/USD technical analysis today shows the pair has been making higher lows, indicating buying interest. However, the bullish momentum appears to be facing challenges at the current resistance, leading to potential consolidation or a pullback if the resistance holds firm.


Key Technical Indicators:

Bollinger Bands:


The price is approaching the upper Bollinger Band, indicating that the currency pair might be entering an overbought territory. This can act as a dynamic resistance level.

Stochastic Oscillator:

The Stochastic Oscillator is at 46.48, approaching the overbought threshold. This can signal that a price correction might be imminent if the overbought level is reached.

RSI (Relative Strength Index):

The RSI is at 49.94, suggesting a neutral to slightly bullish momentum. This indicates that there is still room for the price to move higher before hitting overbought conditions.


Support and Resistance:

Support Levels:


Immediate support is at 1.27045, with a stronger support level at 1.26780.

Resistance Levels:

Immediate resistance is at 1.27391. A break above this level could target higher resistances within the rising channel.


Conclusion and Consideration:

The GBP/USD forecast today depicts the pair to be exhibiting bullish tendencies within a rising channel, supported by neutral to bullish RSI and Stochastic indicators. Traders should watch for a breakout above the resistance at 1.27391 to confirm continued bullish momentum. Given the upcoming fundamental events, particularly from the Bank of England and US economic data, traders should stay vigilant as these can cause significant volatility. Setting appropriate stop-loss levels and monitoring key support and resistance zones is crucial in managing risk.


Disclaimer: The provided analysis is for informational purposes only and does not constitute investment advice. Traders should conduct their own research and analysis before making any trading decisions.


FXGlory
20.06.2024


image_2024-02-15_07_27_41.gif
 
GBPUSD H4 Technical and Fundamental Analysis for 01.07.2024


GBPUSD_H4_Chart_Daily_Technical_and_Funamental_Analysis_on_07_01.jpg


Time Zone: GMT +3
Time Frame: 4 Hours (H4)


Fundamental Analysis:


The GBP/USD news analysis today is influenced by various economic indicators and geopolitical factors. Recently, the pair's performance has been under pressure due to a stronger US Dollar driven by positive economic data, including expectations for the upcoming Final Manufacturing PMI and ISM Manufacturing PMI. The UK's economic outlook remains uncertain amidst concerns over inflation and slower-than-expected economic growth. Bank of England's monetary policy and the broader macroeconomic environment continue to play pivotal roles. The USD has shown resilience due to the Federal Reserve's hawkish stance, while the GBP faces headwinds from domestic economic challenges and Brexit-related uncertainties.

Price Action:

The GBP/USD H4 chart shows that the "Cable" has been in a bearish trend, evident from the price moving below the Ichimoku Cloud. The pair recently attempted a minor recovery but encountered strong resistance at key levels. The downward trendline in the pair's technical analysis today further confirms bearish momentum, with lower highs and lower lows being formed.


Key Technical Indicators:

Ichimoku Cloud:


The price is trading below the Ichimoku Cloud, indicating a prevailing bearish trend. The cloud itself acts as a significant resistance zone.

RSI (Relative Strength Index):

The RSI is currently at 50.63, suggesting a neutral to slightly bearish momentum. It indicates that the market is not overbought or oversold, leaving room for potential downward movement.


Support and Resistance:

Support Levels:


Immediate support is observed at 1.26314, followed by a stronger support level at 1.25670. These levels are crucial for maintaining the bearish structure.

Resistance Levels:

The nearest resistance is at 1.26538, with a more significant resistance level at 1.26850. Breaking above these levels could signal a potential trend reversal.


Conclusion and Consideration:

The GBP/USD forecast today on the H4 chart continues to exhibit a bearish trend for the pair, with key indicators and price action supporting this outlook. Traders should monitor the support levels closely, as a break below 1.26314 could lead to further declines towards 1.25670. Conversely, a sustained break above 1.26538 may challenge the bearish trend, but significant resistance lies at 1.26850. The Cable's fundamental factors of the day, such as economic data releases from both the UK and the US, will be crucial in determining the pair's next move. Risk management strategies, including appropriate stop-loss levels, are essential given the current market volatility.


Disclaimer: The provided analysis is for informational purposes only and does not constitute investment advice. Traders should conduct their own research and analysis before making any trading decisions.


FXGlory
01.07.2024


FXGLORY.gif
 
GBPUSD H4 Technical and Fundamental Analysis for 29.07.2024


GBPUSD_H4_Chart_Daily_Technical_and_Fundamental_Analysis_for_07.jpg


Time Zone: GMT +3
Time Frame: 4 Hours (H4)


Fundamental Analysis:


The GBP/USD news analysis today is significantly influenced by economic indicators from both the United Kingdom and the United States. For the UK, factors such as changes in the money supply, mortgage approvals, and new credit issuance play crucial roles. The recent data from the Bank of England shows an increase in money circulation and credit issuance, suggesting an optimistic economic outlook. In the US, economic indicators such as interest rates, inflation, and job reports affect the dollar. The upcoming Bank of England reports will provide further insights into the UK's economic health, impacting the GBP/USD forecast today.


Price Action:

The GBP/USD H4 chart is exhibiting a downtrend, as indicated by the descending channel formed by the red trend lines. The price is consistently making lower highs and lower lows. The pair also known as the Cable, is struggling to break above the resistance provided by the upper trend line of the channel. This pattern indicates the pair's bearish sentiment.


Key Technical Indicators:

Ichimoku Cloud:


The price has broken below the Ichimoku Cloud, indicating a bearish trend. The conversion line (Tenkan-sen) is below the baseline (Kijun-sen), supporting the bearish outlook. The cloud ahead is bearish, suggesting continued downward pressure.

RSI (Relative Strength Index):

The RSI is currently at 39.70, indicating the market is approaching oversold conditions. A value below 30 would signal an oversold market, potentially leading to a corrective bounce.

MACD (Moving Average Convergence Divergence):

The MACD line is below the signal line, and the histogram is in negative territory, signaling bearish momentum. The divergence between the MACD and the signal line suggests a strengthening downward momentum.


Support and Resistance:

Support Levels:


The immediate support level is around 1.26690, which aligns with the lower trend line of the descending channel.

Resistance Levels:

The nearest resistance is around 1.29215, where the price has previously attempted to break above but failed.


Conclusion and Consideration:

The GBP/USD technical analysis today shows the pair's bearish trend on the H4 timeframe, confirmed by the Ichimoku Cloud, MACD, and RSI indicators. Traders should look for potential sell opportunities, particularly if the price continues to respect the upper trend line of the descending channel. Monitoring upcoming economic releases from both the UK and the US will be crucial as they could influence the Cable's price action. Traders should also be cautious of any corrective bounces that might occur if the RSI reaches oversold levels.


Disclaimer: The provided analysis is for informational purposes only and does not constitute investment advice. Traders should conduct their own research and analysis before making any trading decisions.


FXGlory
29.07.2024


FXGLORY.gif
 
GBPUSD H4 Technical and Fundamental Analysis for 08.01.2024


l_and_Fundamental_Analysis_for_08_01_2024-1024x524.jpg


Time Zone: GMT +3
Time Frame: 4 Hours (H4)


Fundamental Analysis:

The GBP/USD news analysis today is influenced by a variety of fundamental factors. The British Pound is currently affected by the economic outlook in the UK, including inflation rates, interest rates set by the Bank of England, and the overall economic performance as reflected in GDP and employment data. The US Dollar, on the other hand, is influenced by similar factors in the United States, including Federal Reserve policies, inflation rates, and employment figures. Today's economic calendar includes several important data releases for the USD, such as Unemployment Claims and ISM Manufacturing PMI, which are expected to have a high impact on the currency. These releases could provide significant volatility and direction to the GBP/USD pair, also known as the "Cable".


Price Action:
The GBP/USD H4 chart shows the pair trading in a descending channel with clear lower highs and lower lows, indicating the pair's bearish trend. However, the Cable's recent price action suggests a consolidation phase around the 1.2830 - 1.2865 range, which may be forming a base for a potential reversal or continuation pattern. The price is currently testing the upper boundary of the channel, indicating a crucial decision point.


Key Technical Indicators:
Ichimoku Cloud:
The price is trading below the Ichimoku cloud, suggesting a bearish outlook. The cloud ahead is bearish, providing potential resistance for any upward movement.
RSI (Relative Strength Index): The RSI is around the neutral 49 level, suggesting neither overbought nor oversold conditions. This indicates a lack of strong momentum in either direction, aligning with the current consolidation phase.
MACD (Moving Average Convergence Divergence): The MACD line is below the signal line, and the histogram is in negative territory, indicating bearish momentum. However, the narrowing histogram suggests weakening bearish momentum, which could precede a bullish crossover.


Support and Resistance:
Support Levels:
The immediate support levels for the currency pair are at 1.2827 and 1.2810, providing crucial price points where buying interest might emerge to prevent further decline.
Resistance Levels: The resistance levels are at 1.2846 and 1.2865, acting as key barriers where selling pressure might intensify, potentially halting any upward movement.


Conclusion and Consideration:
The GBP/USD technical analysis today shows that the pair is currently in a consolidation phase within a broader downtrend. Key indicators such as the Ichimoku cloud and MACD suggest a bearish bias, while the RSI shows a neutral stance. The upcoming economic releases for the USD, particularly the Unemployment Claims and ISM Manufacturing PMI, could introduce significant volatility to the pair's forecast. Traders should monitor these data points closely, as they could determine the pair's next direction. A break above the 1.2865 resistance could signal a potential trend reversal, while a drop below 1.2827 could confirm the continuation of the bearish trend.


Disclaimer: The provided analysis is for informational purposes only and does not constitute investment advice. Traders should conduct their own research and analysis before making any trading decisions.


FXGlory
08.01.2024


FXGLORY.gif
 
GBPUSD H4 Technical and Fundamental Analysis for 14.08.2024


GBPUSDH4 candlstick chart.jpg


Time Zone: GMT +3
Time Frame: 4 Hours (H4)


Fundamental Analysis:


The GBP/USD forecast today is shaped by ongoing developments in the UK and US economies. In the UK, recent data has shown a slight increase in the unemployment rate, which could suggest a cooling labor market, while inflation remains elevated, keeping the Bank of England on alert for further rate hikes. In the US, economic indicators like the Consumer Price Index (CPI) have shown resilience, keeping the Federal Reserve on a tightrope between taming inflation and sustaining economic growth. These factors create a complex environment for GBP/USD, as traders weigh the relative strength of both currencies.


Price Action:

The GBP/USD price recently broke above a significant dynamic resistance zone, indicating a potential end to the bearish phase that has dominated the market. The price action suggests that the pair is now entering a consolidation phase after this breakout, with the possibility of retesting the recently broken dynamic support zone before continuing its upward trajectory.


Key Technical Indicators:

RSI (Relative Strength Index):
The RSI is currently in the overbought territory, hovering around 72. This suggests that the pair may be due for a short-term correction or consolidation before resuming its upward movement.

MACD (Moving Average Convergence Divergence): The MACD shows a strong buy signal, with the histogram indicating increasing bullish momentum. This aligns with the recent breakout above the resistance zone, supporting the case for further upside potential.


Support and Resistance:

Support Levels:


The nearest support is at 1.27353, which corresponds to the dynamic support zone recently broken. A retest of this level could provide a strong buying opportunity, and this situation is predicted for GBPUSD. Additional support is noted at 1.26641, which would be critical if the pair sees a deeper pullback.

Resistance Levels:

Immediate resistance is seen around 1.28850. This area is forecasted to be an important area for GBPUSD A break above this level could accelerate the bullish trend. Further resistance is noted at 1.29410, which would be the next target for bulls if the current momentum continues.


Conclusion and Consideration:

The GBP/USD H4 chart analysis suggests that the bearish phase may have concluded, with the price now likely to enter a bullish trend following a potential retest of the dynamic support zone. However, traders should be cautious of the RSI being in overbought territory, indicating a possible short-term pullback or consolidation. The strong buy signal from the MACD further reinforces the potential for continued upward movement after any correction. As always, market participants should monitor upcoming economic data and global developments, adjusting their strategies accordingly.


Disclaimer: The provided analysis is for informational purposes only and does not constitute investment advice. Traders should conduct their own research and analysis before making any trading decisions.

FXGlory
14.08.2024


image_2024-02-15_07_27_41.gif
 
GBPUSD H4 Technical and Fundamental Analysis for 22.08.2024


GBPUSD_H4_Chart_Daily_Technical_and_Fundamental_Analysis_for_08.jpg


Time Zone: GMT +3
Time Frame: 4 Hours (H4)


Fundamental Analysis:


The GBP/USD news analysis today is currently influenced by several key economic indicators. For today, the focus is on the U.S. data releases, including Jobless Claims and PMI figures, which will provide insights into the U.S. economy's health. Stronger-than-expected data could bolster the U.S. Dollar, leading to potential changes in the GBP/USD exchange rate. On the other hand, the U.K.'s PMI data and CBI Industrial Trends Survey are essential for gauging the British economy's performance. Better-than-expected U.K. data could support the Pound, but overall for this pair that is also known as the “Cable”, its market sentiment will largely be driven by U.S. economic indicators due to their global impact.


Price Action:

The GBP/USD H4chart, depicts the pair in a clear uptrend, with the price moving within an ascending channel. The recent candles show the Cable’s strong bullish momentum, with the price making higher highs and higher lows. The pair’s price action suggests that the pair is likely to continue its upward trajectory, although the price is currently approaching significant resistance levels that could lead to a temporary pullback or consolidation.


Key Technical Indicators:

Ichimoku Cloud:


The price is well above the Ichimoku Cloud, which is a strong bullish signal. The Tenkan-sen (blue) and Kijun-sen (red) lines are in a bullish crossover, further supporting the upward momentum. The Chikou Span (green) is also positioned above the price, confirming the bullish trend.

RSI (Relative Strength Index):

The RSI is currently around 79.88, indicating that the pair is in overbought territory. While this suggests that the bullish momentum is strong, it also warns of a possible correction or consolidation in the near term as the market may need to cool off.


Support and Resistance:

Support Levels:


Immediate support is located at 1.3034, followed by stronger support at 1.2939, which coincides with the lower boundary of the Ichimoku Cloud.

Resistance Levels:

The pair is currently testing resistance at 1.3089, with the next significant resistance level around 1.3140.


Conclusion and Consideration:

The GBP/USD technical analysis today shows a strong bullish trend, supported by the Ichimoku Cloud and the ascending channel formation. However, the RSI indicates that the pair is overbought, suggesting that a correction could be imminent. Traders should consider the upcoming U.S. economic data releases, which could influence the pair's forecast today. A break above 1.3089 could lead to further gains, but caution is advised due to the overbought RSI. Proper risk management, including setting stop-losses below the lower channel boundary, is recommended to protect against potential market volatility.


Disclaimer: The provided analysis is for informational purposes only and does not constitute investment advice. Traders should conduct their own research and analysis before making any trading decisions.


FXGlory
22.08.2024


image_2024-02-15_07_28_16.gif
 
Back
Top Bottom