• Attention Forex Brokers, FX Companies & Hedge Funds.
    forum.forex is available for Acquisition
    Enquire

EURCAD Daily Analysis

FXGlory Ltd

Well-known member
EURCAD analysis for 04.01.2023


EURCADH4.jpg

Time Zone: GMT +2
Time Frame: 4 Hours (H4)


Fundamental Analysis:


The EURCAD currency pair, represented in the H4 timeframe, is influenced by various economic factors. The Euro is affected by the European Central Bank's policy decisions, economic data releases from the Eurozone, and political stability within the EU. The Canadian Dollar is swayed by commodity prices, particularly oil, due to Canada's status as a major exporter. Trade relationships, economic indicators, and geopolitical events within and between the Eurozone and Canada are crucial for traders to monitor, as they can cause significant volatility in this pair.
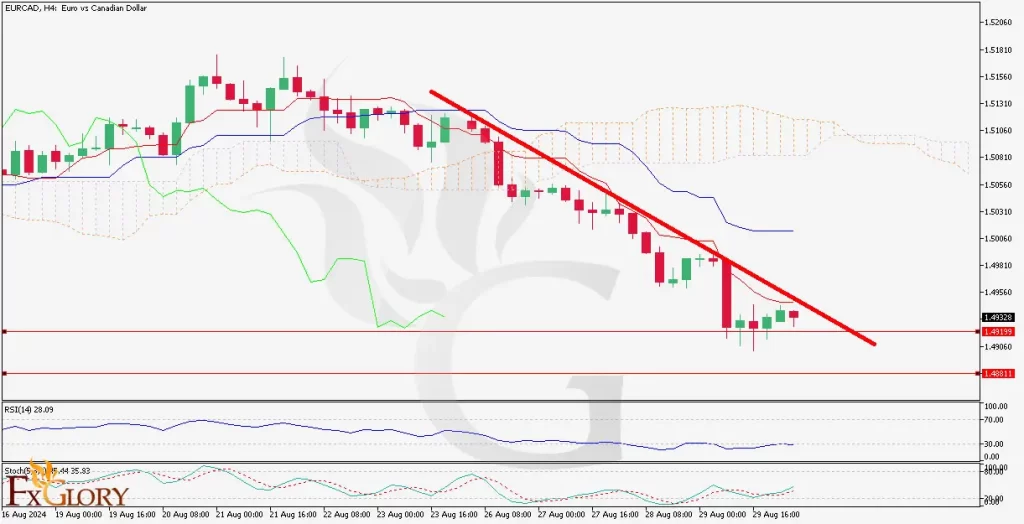

Price Action:

The EURCAD chart shows a period of consolidation with a slight bearish bias, as indicated by the recent lower highs and lower lows. The market seems to be in a phase of indecision, with the candles trading within a narrow range, suggesting a tug-of-war between buyers and sellers.


Key Technical Indicators:

Ichimoku:
The price is trading below the Ichimoku cloud, signaling a bearish trend. The cloud acts as a dynamic resistance.

MACD (Moving Average Convergence Divergence): The MACD line is below the signal line and close to the zero line, indicating a weak bearish momentum.

RSI (Relative Strength Index): The RSI is at 43.17, suggesting a lack of strong momentum in either direction and a potential for sideways movement.

Volumes: The volume is showing spikes below the candlesticks, indicating periods of increased trading activity that correspond with larger price movements.


Support and Resistance:

Support:
The recent low around the 1.4550 level is acting as a support zone.

Resistance: The 1.4700 level, close to the Ichimoku cloud, is serving as the immediate resistance.


Conclusion and Consideration:

The EURCAD pair on the H4 timeframe is currently displaying bearish signals with the price below the Ichimoku cloud and the MACD below its signal line. However, the lack of strong bearish momentum suggested by the RSI indicates that the pair may continue to consolidate. Traders should keep an eye on fundamental factors affecting both currencies, including economic releases and oil price changes. It's also important to watch for a potential break out of the current price range. Risk management strategies should be applied when considering entry and exit points around the identified support and resistance levels.


Disclaimer: This analysis is provided for informational purposes only and does not constitute investment advice. Trading involves risks and it is recommended to perform your own analysis before making any trading decisions.


FXGlory
04.01.2023


FXGLORY.gif
 
EURCAD Daily Technical and Fundamental Analysis for 21.06.2024


EURCAD-H4-Technical and Fundamental Daily Analysis For 21.06.2024.jpg


Time Zone: GMT +3
Time Frame: 4 Hours (H4)


Fundamental Analysis:

The EUR/CAD currency pair reflects the exchange rate between the Euro (EUR) and the Canadian Dollar (CAD). Today, the market expects several news releases for both currencies. For the EUR, significant events include the German Flash Manufacturing PMI (forecasted at 46.4) and the French Flash Services PMI (forecasted at 50.0), both indicating varying degrees of economic activity. Additionally, speeches from key officials like German Buba President Nagel and ECOFIN meetings could provide further market direction. For the CAD, the focus will be on the Core Retail Sales m/m (forecasted at 0.5%) and Retail Sales m/m (forecasted at 0.7%), which are essential indicators of consumer spending and economic health.


Price Action:
Analyzing the EURCAD H4 chart, the pair has shown a sharp bearish trend. The last five bearish candles have driven the price down from the 50.0 Fibonacci retracement line towards the 23.6 Fibonacci retracement line, with the latest candle being green and bullish, indicating a potential pullback. This recent bullish candle at the 23.6 Fibonacci level suggests that this support level might hold, at least in the short term.


Key Technical Indicators:
Ichimoku Cloud:
The Ichimoku Cloud indicator shows that the EUR-CAD forex pair is currently in a bearish trend. The price is below the Kumo (cloud), indicating a bearish bias. The Tenkan-sen (red line) and Kijun-sen (blue line) lines are both above the price, reinforcing the bearish outlook. The Senkou Span A and B (cloud boundaries) are also indicating resistance ahead.
Williams %R: The Williams %R (14) is currently at -94.54, which is in the oversold territory. This suggests that the pair might be due for a short-term rebound or consolidation as the selling pressure may have been exhausted.
Bears Power (13): The Bears Power indicator shows negative values, indicating that the sellers are still in control. However, the indicator has shown a slight uptick recently, which could suggest that the bearish momentum is weakening slightly.


Support and Resistance:
Support:
The immediate support level is at the 23.6% Fibonacci retracement line (1.4645), which coincides with the recent green candle and could act as a strong support level.
Resistance: The nearest resistance level is at the 38.2% Fibonacci retracement line (1.4710), which aligns with a previous consolidation area and could pose a challenge for the bulls if the price attempts to recover.


Conclusion and Consideration:
The EURCAD pair on the H4 chart shows a strong bearish momentum supported by the Ichimoku Cloud, %R14, and Bears Power indicators. The recent bearish candles indicate that the selling pressure is still present, but the oversold condition of %R14 and the latest bullish candle suggest a possible short-term pullback or consolidation at the 23.6% Fibonacci retracement level. Traders should watch the key support and resistance levels closely, as any breach could indicate the next potential move. Given the upcoming economic releases and speeches, increased volatility can be expected, and traders should stay updated with the latest information.


Disclaimer: The EURCAD technical and fundamental analysis provided is for informational purposes only and does not constitute investment advice. Traders should conduct their own research and analysis before making any trading decisions. Market conditions can change rapidly, and it is essential to stay updated with the latest information.


FXGlory
21.06.2024


FXGLORY.gif
 
EURCAD H4 Technical and Fundamental Analysis for 07.16.2024


EURCAD_H4_Chart_Daily_Technical_and_Fundamental_Analysis_for_07.jpg


Time Zone: GMT +3
Time Frame: 4 Hours (H4)


Fundamental Analysis:

The EUR/CAD forecast today reflects the economic health and policy decisions of the Eurozone and Canada. For the Euro, upcoming data releases such as the IT Trade Balance, EZ Trade Balance, and ZEW Economic Sentiment Index are key indicators. Positive trade balance figures and optimistic sentiment from institutional investors can boost the Euro. Conversely, Canada's economic health is gauged by indicators like housing starts and various Consumer Price Index (CPI) measures. A higher-than-expected CPI may prompt a hawkish stance from the Bank of Canada, strengthening the CAD.


Price Action:
The EUR/CAD H4 chart is in a clear uptrend, characterized by higher highs and higher lows. The pair is currently trading above key support levels and is testing a significant resistance zone. The EUR/CAD price action indicates the pair's strong bullish momentum, suggesting further potential upside.


Key Technical Indicators:

Parabolic SAR
:
The Parabolic SAR dots are positioned below the current price, indicating an ongoing uptrend. This supports the bullish sentiment, suggesting the trend is likely to continue unless a significant reversal occurs.

RSI (Relative Strength Index):
The RSI is at 80.51, indicating overbought conditions. This suggests that the bullish momentum might be due for a correction, as the price has reached an extreme level. Traders should be cautious of potential pullbacks.

MACD (Moving Average Convergence Divergence):
The MACD histogram is positive, with the MACD line above the signal line. This bullish crossover signals strong upward momentum, confirming the uptrend in price action.


Support and Resistance:

Support Levels:

The nearest support is at 1.48143, with additional support at 1.47500. These levels are critical for maintaining the current uptrend.

Resistance Levels:
The pair is facing resistance at 1.48727 and a stronger resistance at 1.49300. A break above these levels could signal a continuation of the bullish trend.


Conclusion and Consideration:
The EUR/CAD H4 chart demonstrates its robust bullish signals, with the Parabolic SAR, MACD, and recent price action supporting further upside. However, the RSI indicates overbought conditions, suggesting a possible short-term pullback or consolidation. Traders should monitor key resistance levels for potential breakouts while setting stop losses near support levels to manage risk. The pair's Fundamental news releases for both the Eurozone and Canada will be crucial in influencing market sentiment and price direction.


Disclaimer: The provided analysis is for informational purposes only and does not constitute investment advice. Traders should conduct their own research and analysis before making any trading decisions.


FXGlory
07.16.2024


FXGLORY.gif
 
EURCAD H4 Technical and Fundamental Analysis for 07.08.2024


ch1.jpg


Time Zone: GMT +3
Time Frame: 4 Hours (H4)


Fundamental Analysis:

The EURCAD currency pair represents the exchange rate between the Euro (EUR) and the Canadian Dollar (CAD). Recent economic data from both the Eurozone and Canada indicate potential influences on this pair.

Euro (EUR)

  • German Industrial Production m/m: The latest data shows an increase of 1.0%, a significant recovery from the previous -2.5%. This indicates a rebound in Germany's industrial sector, which is positive for the EUR.
  • German Trade Balance: The trade balance stands at 21.7B, slightly below the previous 24.9B. While this shows a slight decrease, the large surplus continues to support the EUR.
Canadian Dollar (CAD)

  • Ivey PMI: The latest figure is 60.0, lower than the previous 62.5. A PMI above 50 generally indicates expansion, but the drop suggests a slowing pace of growth, which could weaken the CAD.
  • BOC Summary of Deliberations: The Bank of Canada's recent deliberations will provide insight into future monetary policy, which is crucial for the CAD's strength. Any dovish tone could negatively impact the CAD.


Price Action:
The EURCAD pair has been through a bearish phase and is currently testing a significant support zone around the 1.50000 level. This area is crucial as it has held in the past, providing a potential floor for the pair.


Key Technical Indicators:

MACD (Moving Average Convergence Divergence):
The MACD indicator shows that although the trend has been bearish, the MACD line is trending higher, suggesting decreasing bearish momentum. The histogram supports this with declining negative values.
RSI (Relative Strength Index): The RSI is in a neutral area, around 40, indicating that the pair is not currently oversold or overbought. This suggests that the current price level is a potential point of consolidation or reversal.
Support and Resistance:
Support
: Immediate support is located at 1.50000. This level is critical as it has been tested recently and held firm, indicating strong buying interest.

Resistance: The nearest resistance level is at 1.50313, followed by 1.49961, which aligns with recent highs and the descending trend line.


Conclusion and Consideration:

The EURCAD pair on the H4 chart indicates a potential consolidation or reversal at the 1.50000 support level. The MACD and RSI indicators suggest that the bearish momentum might be waning, offering a possible opportunity for bulls. Traders should monitor this support area closely for potential buying opportunities, especially if the pair holds above 1.50000. Upcoming economic releases from both the Eurozone and Canada will be crucial, as they can introduce significant volatility and potentially alter trend dynamics.


Disclaimer: The EURCAD provided analysis is for informational purposes only and does not constitute investment advice. Traders should conduct their own research and analysis before making any trading decisions. Market conditions can change rapidly, and it is essential to stay updated with the latest information. Always consider risk management strategies and consult with a financial advisor if necessary.


FXGlory
07.08.2024


image_2024-02-15_07_27_41.gif
 
EUR/CAD H4 Technical and Fundamental Analysis for 08.30.2024
EURCADH4-1-1024x524.webp


Time Zone: GMT +3
Time Frame: 4 Hours (H4)


Fundamental Analysis:


The upcoming economic data releases from both the US and Japan are set to influence the USD/JPY pair's direction prediction. In the US, key indicators such as the S&P/CS Composite-20 HPI y/y, HPI m/m, CB Consumer Confidence, and Richmond Manufacturing Index will be released. The S&P/CS Composite-20 HPI y/y is expected to show a slight decrease from 6.8% to 6.2%, indicating a cooling in the housing market. Meanwhile, the CB Consumer Confidence index is expected to rise to 100.9 from a previous 100.3, suggesting improved consumer sentiment. The Richmond Manufacturing Index is projected to show an improvement from -17 to -14, which still indicates contraction but at a slower pace. These mixed data points could create a volatile trading environment for the USD.

On the Japanese side, the Services Producer Price Index (SPPI) y/y is forecasted to slightly decrease from 3.0% to 2.9%, signaling a potential slowdown in price pressures; which stands as an important forecast element for this fore pair. The BOJ Core CPI y/y is expected to remain stable at 2.1%, suggesting persistent inflation concerns within Japan. The stable inflation rate and the recent dovish stance of the Bank of Japan could continue to exert downward pressure on the JPY.


Price Action:

The USD/JPY pair is forming a bearish flag pattern on the H4 chart after a significant bearish wave, which suggests a potential continuation of the downward trend. The price is currently consolidating within this pattern, and a breakout to the downside could accelerate the bearish momentum. However, the presence of bullish technical indicators points to a possible short-term corrective wave.


Key Technical Indicators:

Support Levels:
The immediate support is at 1.4881. A break below this level could see the pair testing lower support zones, which may align with historical lows.

Resistance Levels: The immediate resistance is the descending trend line. A successful breakout above this line, confirmed with a close above 1.4932, could indicate a shift to a bullish phase, targeting higher resistance areas.


Support and Resistance:

Support Levels:
The nearest support is at the lower trendline of the bearish flag pattern, around 144.00. A break below this level could see the pair testing the next support near 142.50, which aligns with previous lows.

Resistance Levels: Immediate resistance is at the upper trendline of the bearish flag, around 145.00. A break above this level could target the next resistance at 146.50, potentially invalidating the bearish flag pattern and signaling a bullish reversal.


Conclusion and Consideration:

The EUR/CAD H4 chart suggests that while the pair is in a bearish trend, technical indicators are showing signs of a potential short-term reversal due to bullish divergence and oversold conditions. Fundamental factors, including weaker-than-expected Eurozone inflation data and slightly weaker Canadian GDP figures, could provide mixed influences on the pair. Traders should closely monitor the price action around the descending trend line for potential breakout opportunities, either to the upside for a buy signal or to the downside below the support level for a sell signal.


Disclaimer: The provided analysis is for informational purposes only and does not constitute investment advice. Traders should conduct their own research and analysis before making any trading decisions.

FXGlory
08.30.2024

image_2024-02-15_07_27_41.gif
 
Back
Top Bottom