• Attention Forex Brokers, FX Companies & Hedge Funds.

    forum.forex is available for Acquisition

    Enquire

GBPAUD analysis

FXGlory Ltd

Well-known member
GBPAUD analysis for 03.11.2023


GBPAUD.jpg


Time Zone: GMT +2
Time Frame: 4 Hours (H4)


Fundamental Analysis:

The GBPAUD currency pair represents the exchange rate between the British Pound and the Australian Dollar. Key determinants of this pair include monetary policy decisions from both the Bank of England (BoE) and the Reserve Bank of Australia (RBA). Additionally, trade relations, geopolitical events, and major economic indicators, such as employment statistics and inflation rates from both nations, significantly influence the pair's movements. As the UK navigates post-Brexit economic scenarios and Australia's reactions to commodity prices evolve, traders need to stay updated on these crucial developments.


Price Action:
The H4 chart for GBPAUD shows a general bearish trend, as evidenced by the recent downward movement. While there were intermittent bullish retracements, the dominant force appears to be sellers in the current timeframe.


Key Technical Indicators:

Ichimoku:
The price is below the cloud, indicating a bearish trend. Moreover, the Tenkan-sen (green line) is below the Kijun-sen (blue line), reinforcing the bearish sentiment.

RSI (Relative Strength Index): Positioned at approximately 38.12, the RSI is in the middle zone. Although it's not in the oversold or overbought territories, its current direction hints at a continuation of the bearish momentum.

Volumes: The volume bars suggest mixed trading activity. There are spikes in volumes at certain bearish candles, pointing towards a stronger bearish sentiment during those periods.

MACD: The MACD line is below the signal line and has been diverging further, which is a bearish signal. Additionally, the histogram shows an increasing bearish momentum.


Support and Resistance:

Resistance:
The 1.92500 level stands out as a prominent resistance, where the price faced multiple rejections.

Support: The 1.8890 region acts as the immediate support level, with price hovering close to this zone.


Conclusion and Consideration:

The GBPAUD pair on the H4 timeframe exhibits a pronounced bearish tone. The price action below the Ichimoku cloud, combined with the RSI's downward trajectory and the MACD's bearish divergence, consolidates this view. Traders should remain watchful of the identified support and resistance levels while integrating the underlying fundamental factors from both the UK and Australia to obtain a comprehensive market understanding.


Disclaimer: We do not suggest any investment advice, and these analyses are just to increase the traders' awareness but not a certain instruction for trading.


FXGlory
03.11.2023


FXGLORY.gif
 
GBPAUD analysis for 07.11.2023


11-7.jpg


Time Zone: GMT +2
Time Frame: 4 Hours (H4)

Fundamental Analysis:

The GBPAUD pair represents the exchange rate between the British Pound (GBP) and the Australian Dollar (AUD). Factors affecting this currency pair often include economic indicators from both the UK and Australia, such as interest rate decisions, GDP growth rates, employment changes, and trade balances. Additionally, global commodity prices, particularly metal and mineral markets, significantly impact the AUD due to Australia's large export economy. Brexit-related news continues to influence the GBP as the UK adjusts its trade and economic policies post its exit from the European Union. As these economies react to changes in global financial stability and currency market volatility, these fundamental aspects must be monitored closely by traders.

Price Action:
The H4 chart for GBPAUD displays a descending trendline, indicating a bearish bias in recent price movements. The pair has been making lower highs, which is characteristic of a downtrend. However, there is also a level of support that has been tested multiple times, suggesting a consolidation phase could be forming.


Key Technical Indicators:

RSI (Relative Strength Index):
The RSI is hovering just above the 30 level, suggesting that the market may be in oversold territory and could potentially reverse or bounce back in the short term.

Volumes: The trading volume has shown variability with spikes that may correspond with price volatility. This indicates a market that is actively engaged with the current price trend.

MACD (Moving Average Convergence Divergence): The MACD line is below the signal line and has been residing in negative territory, confirming the bearish momentum. However, the histogram shows reduced bearish momentum, which could suggest a potential weakening of the current downtrend.


Support and Resistance:

Resistance:
The descending trendline currently near the 1.9132 level acts as a dynamic resistance.

Support: The horizontal support line around the 1.8883 level has been tested multiple times, indicating a strong area of buyer interest.


Conclusion and Consideration:

The GBPAUD pair on the H4 timeframe is exhibiting a bearish trend, highlighted by the descending trendline. The RSI and MACD indicators support this view but also caution about the potential for a reversal given the RSI's proximity to the oversold territory and the MACD's reduced negative momentum. Traders should stay vigilant for any shifts in fundamental factors from both the UK and Australia that might influence the pair's direction. Given the current price action, there may be opportunities to look for bearish signals off the trendline or bullish signals for a potential bounce from support. It's advisable for traders to use stop losses and consider profit targets around the key support and resistance levels to manage risks appropriately.


Disclaimer: We do not suggest any investment advice, and these analyses are just to increase the traders' awareness but not a certain instruction for trading.


FXGlory
07.11.2023


FXGLORY-CRYPTO.gif
 
GBPAUD analysis for 14.03.2024


EURUSDH4-Daily-Analysis-12.03.jpg


Time Zone: GMT +2
Time Frame: H4


On the 4-hour timeframe, GBPAUD's trajectory is bearish, as indicated by its persistent position below the Ichimoku cloud, complemented by a pattern of declining peaks and troughs. The RSI remains subdued below 40, alluding to sustained bearish pressure, a view that is echoed by the MACD's current stance. Support is presently found at 1.93285, with resistance encountered near 1.94715. Economic data from both the UK and Australia, as well as the overarching mood of global risk, remain pivotal in directing the currency pair. The implementation of prudent risk management practices is advised in light of possible market swings.


Disclaimer: This analysis is strictly for informational purposes and should not be construed as investment advice. Individual research and risk assessment are imperative for traders prior to engaging in trading.


Click here to delve into comprehensive market insights and strategic trading advice.


FXGlory
14.03.2024


FXGLORY.gif
 
GBPAUD analysis for 21.05.2024


GBPAUD Daily Market Analysis H4 for 21.05.2024.jpg


Time Zone: GMT +3
Time Frame: 4 Hours (H4)


Fundamental Analysis:

The GBP/AUD price is influenced by various economic factors, including interest rate differentials between the Bank of England and the Reserve Bank of Australia, economic indicators, and geopolitical events. Today, Bank of England Governor Bailey is scheduled to speak, which could provide insights into the future monetary policy stance of the UK, potentially impacting the GBP. Traders will be attentive to any hawkish comments that might bolster the GBP, especially given the recent market volatility. This speech could offer significant insights into the economic outlook and monetary policy adjustments, influencing the Great Britain pound against the Australian dollar.


Price Action:
The H4 forex GBP/AUD chart shows a recovery trend after the price touched the 23.6% Fibonacci retracement level. The price action suggests a potential bullish momentum as the MACD is showing strong potential for a bullish wave, indicating a chance for bulls to take control of the market once more. Additionally, the price has recently broken the resistance level at 1.90230, and a retest of this level is probable. This retest could provide a significant buying opportunity if the level holds as support, suggesting further upward movement.


Key Technical Indicators:
MACD (Moving Average Convergence Divergence):
The MACD indicator is showing a bullish crossover, indicating increasing upward momentum. This crossover suggests that the price may continue to rise as buying pressure builds.
RSI (Relative Strength Index): The RSI is currently above the 60 level, indicating that the market is gaining bullish strength but is not yet overbought. This suggests there is still room for further upward movement before reaching overbought conditions.


Support and Resistance:
Support:
The immediate support level is at 1.90230, which was recently broken and is now likely to be retested. If this level holds, it could act as a strong foundation for further bullish moves.
Resistance: The next significant resistance level to watch is around 1.9150, followed by a higher resistance at approximately 1.9275, which aligns with the 50% Fibonacci retracement level.


Conclusion and Consideration:
The GBP/AUD pair on the H4 chart is showing promising signs of a bullish reversal after rebounding from the 23.6% Fibonacci retracement level. Key technical indicators, such as the MACD and RSI, suggest increasing bullish momentum, indicating potential further upside. Traders should keep an eye on the retest of the 1.90230 support level, as holding above this level could confirm the bullish trend. Additionally, any hawkish comments from BOE Governor Bailey today may strengthen the GBP further, supporting the bullish outlook. It is essential to monitor these developments closely for informed trading decisions.


Disclaimer: The provided analysis is for informational purposes only and does not constitute investment advice. Traders should conduct their own research and analysis before making any trading decisions.


FxGlory
21.05.2024


FXGLORY.gif
 
GBP/AUD H4 Technical and Fundamental Analysis for 13.08.2024


GBPAUD.jpg


Time Zone: GMT +3
Time Frame: 4 Hours (H4)


Fundamental Analysis:


The GBP/AUD forecast today is influenced by a mix of economic indicators from both the UK and Australia that paint a complex picture of the potential market directions. The UK sees a decrease in Claimant Count Change and a slight uptick in the Unemployment Rate, combined with a reduction in the Average Earnings Index. In contrast, Australia's economic indicators such as the Westpac Consumer Sentiment and NAB Business Confidence show a mixed economic sentiment, while the Wage Price Index suggests rising wage pressures. These data releases provide critical insights into the economic health of both nations, influencing the GBP/AUD trading strategy.


Price Action:

The GBP/AUD pair has been experiencing a bearish wave but shows signs of potential reversal. The price action is forming a descending triangle, with recent lows higher than previous ones, indicating weakening downward momentum. Traders should closely monitor this pattern for a breakout which could signal a new trend.


Key Technical Indicators:

RSI (Relative Strength Index):
The RSI nears 45 and shows signs of a bullish reversal, which aligns with the weakening bearish momentum observed in the price action. This suggests that the current bearish trend might be losing strength.
MACD (Moving Average Convergence Divergence): The MACD indicates a decline in bearish momentum with the histogram showing less negativity, suggesting a potential shift towards a bullish market phase if the descending triangle resistance is breached.


Support and Resistance:

Support Levels:

The nearest support is at 1.93200, with additional support at 1.93000. These levels are crucial for maintaining the broader uptrend.
Resistance Levels:
The pair is facing resistance at 1.94655, with stronger resistance at 1.95555. A break above these levels could signal a continuation of the bullish trend.


Conclusion and Consideration:

The GBP/AUD H4 chart suggests that the bearish momentum is fading with key economic indicators and technical signals pointing towards a possible trend reversal. The outcome of the current patterns could be significantly influenced by further economic releases and market sentiment. Traders should maintain vigilance and adjust their strategies based on the evolving market conditions and economic data.


Disclaimer: The provided analysis is for informational purposes only and does not constitute investment advice. Traders should conduct their own research and analysis before making any trading decisions.

FXGlory
13.08.2024


image_2024-02-15_07_27_41.gif
 
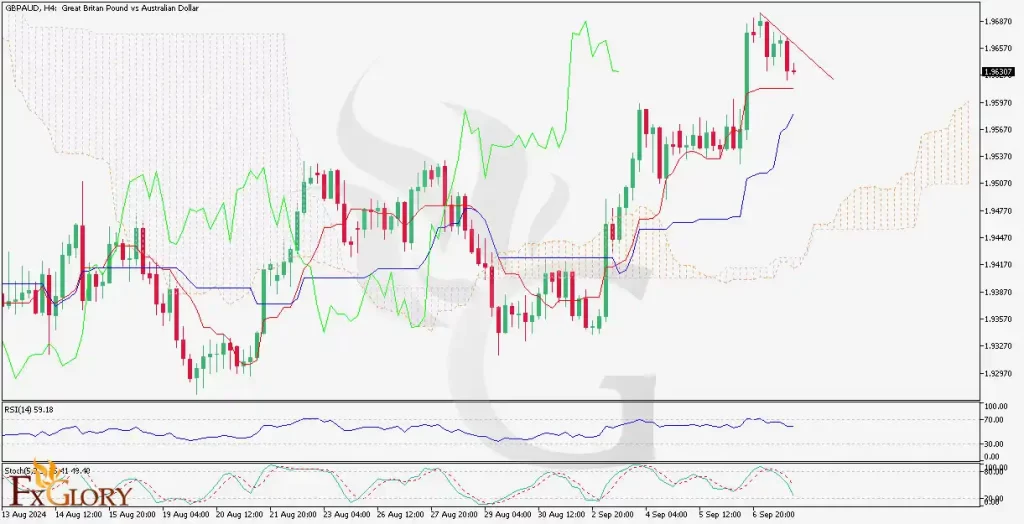
GBPAUD H4 Technical and Fundamental Analysis for 09.10.2024


GBPAUDH4-technical-and-fundamental-analysis-for-09.10.2024-1024x524.webp


Time Zone: GMT +3
Time Frame: 4 Hours (H4)


Fundamental Analysis:

Upcoming economic data releases from both the UK and Australia will play a crucial role in predicting the direction of the GBP/AUD pair. Key releases for the GBP currency include Claimant Count Change, Average Earnings Index 3m/y, and the Unemployment Rate. The Claimant Count Change is expected to show an improvement from 135K to 95.5K, suggesting a slight improvement in the UK labor market. Average Earnings Index 3m/y is forecasted to dip from 4.5% to 4.1%, indicating weaker wage growth. The Unemployment Rate is projected to hold steady at 4.1%, which may keep investor confidence intact but limits any significant bullish move in the GBP.
On the Australian side, the Westpac Consumer Sentiment data, along with the NAB Business Confidence report, is expected to provide insights into the current economic outlook. If both data sets show improving confidence, it could strengthen the AUD in the short term.


Price Action:
The GBP/AUD price line has entered a correction phase after a strong bullish wave. Currently, the price is consolidating above the Ichimoku cloud, which suggests that bullish sentiment may remain dominant in the near future. RSI (Relative Strength Index) is not yet in the overbought area, and the stochastic indicator shows that the bearish momentum is nearly exhausted. Traders should keep an eye on the bearish trend line within this correction phase, as a breakout above this area could signal the continuation of the bullish trend.


Key Technical Indicators:
RSI:
The RSI is hovering below the overbought level, suggesting more room for upward movement before reaching overextended conditions.
Stochastic: The stochastic oscillator is showing signs of reaching the end of a bearish run, hinting at a potential bullish crossover.
Ichimoku Cloud: The price has broken above the cloud, which is a bullish signal, and could indicate further upside if the price sustains above this area.


Support and Resistance:
Support Levels:
The nearest support is at 1.9500, just above the lower boundary of the Ichimoku cloud. A break below this level could signal further bearish correction toward 1.9450.
Resistance Levels: Immediate resistance is at the descending trend line formed in the current correction phase. A breakout above 1.9600 could confirm a continuation of the bullish trend, targeting the next resistance around 1.9700.


Conclusion and Consideration:
The GBP/AUD H4 chart suggests that while the pair is undergoing a corrective phase, the overall sentiment remains bullish due to the price holding above the Ichimoku cloud. If the price breaks above the current descending trend line during this correction, bulls are likely to take over the market again. Traders should also pay close attention to upcoming GBP and AUD economic data releases, as these can highly influence the pair’s movement in the short term.


Disclaimer: The provided analysis is for informational purposes only and does not constitute investment advice. Traders should conduct their own research and analysis before making any trading decisions.


FXGlory
09.10.2024


FXGLORY-Crypto - Discount - .gif
 
GBPAUD H4 Technical and Fundamental Analysis for 09.19.2024


l-and-Fundamental-Analysis-for-09.19.2024-1024x524.webp


Time Zone: GMT +3
Time Frame: 4 Hours (H4)


Fundamental Analysis:

The GBPAUD pair represents the British Pound (GBP) against the Australian Dollar (AUD), both of which are influenced by central bank policies and global economic conditions. Today, the GBP faces significant news with the release of the Bank of England's Monetary Policy Summary and voting breakdown, which could provide insight into the central bank's stance on interest rates. Hawkish sentiments from the Bank of England could strengthen the GBP, leading to potential bullish momentum. On the AUD side, employment data and the unemployment rate are key market-moving events for today. Better-than-expected Australian employment figures could bolster the AUD, adding downward pressure on the pair. Both currencies are subject to central bank guidance and economic data, making today critical for GBP AUD price movements.


Price Action:
On the H4 timeframe, the GBP/AUD pair is currently showing bearish tendencies, as seen from the last two candles that have declined. The price is trading between the 38.2% and 50.0% Fibonacci retracement levels, indicating potential support near the 50.0% level. The GBPAUD Price action shows movement toward the lower half of the Bollinger Bands after briefly touching the middle band. This suggests a potential downward continuation. If the price breaks below the 50.0% Fibonacci level, we could see further bearish momentum.


Key Technical Indicators:
Bollinger Bands:
The price has been moving from the lower band toward the middle band but is currently heading back toward the lower band. This indicates a bearish move, with volatility expected to increase as the price approaches the lower Bollinger Band. If the price remains in the lower half of the bands, it may continue on a downward path.
MACD (Moving Average Convergence Divergence): The MACD histogram is showing decreasing momentum, with the MACD line slightly below the signal line. This suggests bearish momentum is building, and traders should watch for a potential continuation of the downward trend if the MACD crosses further below the signal line.
DeMarker (DeM) (14): The DeMarker indicator currently sits at 0.260, which is below the neutral zone, indicating that the pair is nearing oversold conditions. While this suggests that the selling pressure could slow down, it also signals that there may be room for further bearish movement before a possible reversal.


Support and Resistance Levels:
Support:
Immediate support is found at the 50.0% Fibonacci retracement level at approximately 1.9502. Further support can be seen near the 61.8% Fibonacci level at 1.9440.
Resistance: Immediate resistance is near the 38.2% Fibonacci level at 1.9562. Stronger resistance lies at 1.9600, aligning with the upper Bollinger Band.


Conclusion and Consideration:
In conclusion, the GBP AUD pair on the H4 chart shows signs of bearish momentum with the price moving toward the lower half of the Bollinger Bands and declining MACD momentum. The DeM indicator nearing oversold territory signals potential for a short-term reversal, but the overall bearish outlook remains dominant. Traders should watch key support and resistance levels, particularly around the 50.0% and 38.2% Fibonacci levels, for signs of a breakout or reversal. With important economic data releases from both the UK and Australia, heightened volatility is expected, making it crucial for traders to monitor these indicators closely.


Disclaimer: The GBPAUD H4 provided analysis is for informational purposes only and does not constitute financial advice. Traders should perform their own analysis and consider market conditions before making any trading decisions. Markets can change rapidly, and staying updated with the latest news is essential for successful trading.


FXGlory
09.19.2024


FXGLORY.gif
 
Back
Top Bottom