• Attention Forex Brokers, FX Companies & Hedge Funds.

    forum.forex is available for Acquisition

    Enquire

AUDUSD Daily Analysis

FXGlory Ltd

Well-known member
AUDUSD analysis 02.11.2023


AUDUSDH4.jpg


Time Zone:
GMT +2
Time Frame: 4 Hours (H4)


Fundamental Analysis:
The AUD/USD currency pair represents the exchange rate between the Australian Dollar and the US Dollar. Key drivers of this pair are monetary policy decisions from the Reserve Bank of Australia (RBA) and the Federal Reserve. Additionally, economic indicators from both countries, such as employment figures, GDP data, and commodity prices, play crucial roles, especially given Australia's dependency on commodity exports. Traders should continuously monitor these factors to grasp a clearer view of the pair's potential direction.


Price Action:
The H4 chart for AUD/USD displays alternating bullish and bearish trends. The most recent price movement demonstrates a notable bullish push, suggesting that buyers have gained some momentum in this timeframe.


Key Technical Indicators:
Bollinger Bands:
Prices have moved within the Bollinger Bands, indicating periodic volatility. The central moving average has served as both support and resistance, providing dynamic points of interest.

RSI (Relative Strength Index): The RSI, positioned at approximately 68.10, is nearing the overbought threshold. This suggests potential over-extension and a possible retracement.

Parabolic SAR: The recent placement of the dots below the price suggests a bullish trend. However, traders should be watchful as the Parabolic SAR can quickly switch, indicating trend reversals.

Volumes: Visible volume bars show varying buying and selling activity. A heightened volume during an uptrend implies a strong bullish sentiment, while increased volume during downtrends might suggest a bearish sentiment.


Support and Resistance:
Resistance:
The 0.65050 zone is evident as an immediate resistance for the pair.
Support: The 0.62850 region acts as a significant support level, with the price respecting this area on multiple occasions.


Conclusion and Consideration:
The AUD/USD pair on the H4 timeframe reveals a slightly bullish inclination due to recent upward price movements. The nearing overbought condition signaled by the RSI suggests caution and the possibility of a minor pullback. The Parabolic SAR currently supports this bullish sentiment, but its dynamic nature means traders should remain vigilant. Defining trades around the identified support and resistance, and blending technical insights with fundamental data from Australia and the US, will furnish traders with a more holistic perspective on market trends.


Note: We do not suggest any investment advice, and these analyses are just to increase the traders' awareness but not a certain instruction for trading.


FXGlory
02.11.2023


FXGLORY.gif
 
Last edited:
AUDUSD analysis for 01.12.2023


AUDUSDH4.jpg


Time Zone: GMT +2
Time Frame: 4 Hours (H4)


Fundamental Analysis:


The AUDUSD pair, representing the Australian Dollar against the US Dollar, is influenced by a myriad of economic factors. Central bank policies, specifically the Reserve Bank of Australia (RBA) and the Federal Reserve (Fed), significantly impact this currency pair. Commodity prices, especially iron ore and coal, are crucial for the AUD due to Australia's export-driven economy. Meanwhile, the USD is swayed by US economic indicators and global risk sentiment. The interplay between Australia's trade balance data and the US's fiscal and monetary policies is key to understanding the AUDUSD dynamics.


Price Action:

The H4 timeframe shows a fluctuating trend with a recent upward surge followed by a slight retracement. The price movement is above the moving average, indicating a possible bullish sentiment in the market. However, the formation of smaller bullish candles suggests a potential slowdown in upward momentum.


Key Technical Indicators:

RSI (Relative Strength Index):
The RSI is hovering around the midpoint at 51.67, signaling a balance between buying and selling pressures without clear overbought or oversold conditions.

MACD (Moving Average Convergence Divergence): The MACD line is slightly above the signal line but close to the zero axis, indicating a weak bullish momentum that could be prone to reversal.

Parabolic SAR: The appearance of the last three dots above the price candles points to a potential downtrend as the indicator suggests a stop and reversal of the previous bullish trend.


Support and Resistance:

Support:
The nearest support level appears to be around the 0.63200 mark, which has previously acted as both support and resistance.

Resistance: The recent high near the 0.65300 level may act as the immediate resistance, which if broken, could indicate a continuation of the uptrend.


Conclusion and Consideration:

The AUDUSD pair on the H4 chart shows signs of bullish price action, although the momentum is not strongly supported by the key technical indicators, which show a more neutral stance. The RSI and MACD suggest a balance in market forces, while the Parabolic SAR hints at a possible change in direction. Traders should be cautious of potential shifts in trend and prepare for both continuation and reversal scenarios. Monitoring upcoming economic reports from both the RBA and the Fed, as well as global commodity prices, will be crucial. Risk management strategies, including stop losses and profit targets, should be aligned with the current support and resistance levels.


Disclaimer:
This analysis is for educational purposes only and should not be considered as financial advice. Trading involves risk, and it is recommended to conduct your own research before making any investment decisions.


FXGlory
01.12.2023


FXGLORY.gif
 
AUDUSD Daily Technical and Fundamental Analysis for 30.05.2024


AUDUSD-H4-Daily-Technical-and-Fundamental-Analysis-on-30-05-2024.jpg


Time Zone: GMT +3
Time Frame: 4 Hours (H4)


Fundamental Analysis:


The AUDUSD currency pair chart represents the exchange rate between the Australian Dollar (AUD) and the US Dollar (USD). This pair is highly influenced by economic indicators from both Australia and the United States, making it a critical focus for forex traders. Monitoring the AUD/USD chart price is essential for understanding market trends and potential trading opportunities in the forex market. Today, the Australian Dollar (AUD) is influenced by low-impact economic events. RBA Assistant Governor Sarah Hunter's speech is unlikely to introduce significant market volatility but could offer subtle insights into future monetary policy. Additionally, data on Building Approvals (forecasted at 1.8%) and Private Capital Expenditure (forecasted at 0.6%) are due, which are essential indicators of economic health, though they are expected to have low impact. In contrast, the US Dollar (USD) faces high-impact events including Preliminary GDP data (forecasted at 1.2%), Unemployment Claims (forecasted at 218K), and Pending Home Sales (forecasted at -1.1%). These events are pivotal and could induce substantial market movements, reflecting the USD's overall economic health.


Price Action:

AUDUSD On the H4 timeframe, has been displaying a mix of bearish and bullish sentiments. Over the last five candles, three were bearish, showing a downward trend, while the last two candles are bullish, suggesting a potential reversal. This AUD/USD price action is notable as it indicates a shift in market sentiment with the possibility of further upward movement of the AUD USD chart price if the bullish momentum continues.


Key Technical Indicators:

Bollinger Bands:
The bands are widening smoothly, indicating increased volatility. The last five candles have been moving in the lower part of the bands, showing a bearish trend. However, the last two bullish candles suggest a possible upward correction or reversal in the AUD-USD price.

Parabolic SAR: The Parabolic SAR dots have been above the candles for the last 10 spots, which is a bearish signal. This indicates that the market is still in a downtrend, but traders should watch for any shift below the price, which would indicate a potential trend reversal.

MACD (Moving Average Convergence Divergence): The MACD line is below the signal line, and both are below the zero line, reflecting bearish momentum. However, the histogram shows a slight decrease in bearish pressure, hinting at a potential bullish crossover if the current trend continues.

RSI (Relative Strength Index): The RSI is at 38.55, indicating that the AUDUSD is approaching oversold territory. This level suggests a potential for an upward correction if the buying pressure increases.


Support and Resistance:

Support Levels:
The immediate support is at 0.6580, a psychological level and a recent low. Below this, further support can be found at 0.6560.

Resistance Levels: The nearest resistance is at 0.6640, a level tested by recent price action. Above this, significant resistance lies at 0.6685, aligned with the 50% Fibonacci retracement level.


Conclusion and Consideration:

The AUDUSD on the H4 chart shows mixed signals. The widening Bollinger Bands suggest increased volatility, and the Parabolic SAR indicates a prevailing bearish trend. However, the recent bullish candles, combined with an RSI approaching oversold levels, and a potentially converging MACD, hint at a possible upward correction. Traders should closely monitor upcoming US economic data releases, as they are likely to drive significant market movements. It's prudent to consider both bullish and bearish scenarios, implementing appropriate risk management strategies.


Disclaimer: The provided AUDUSD chart analysis is for informational purposes only and does not constitute investment advice. Traders should conduct their own research and analysis before making any trading decisions. Market conditions can change rapidly, and it is essential to stay updated with the latest information.


FxGlory
30.05.2024


FXGLORY.gif
 
AUDUSD H4 Technical and Fundamental Analysis for 07.09.2024


AUDUSD_H4_Chart_Daily_Technical_and_Fundamental_Analysis_for_07.jpg


Time Zone: GMT +3
Time Frame: 4 Hours (H4)


Fundamental Analysis:


The AUD/USD news analysis today is influenced by a combination of economic indicators and geopolitical factors. For the Australian dollar, key factors include the Westpac Consumer Sentiment Index and the NAB Business Confidence survey. Both indicators reflect the economic health and confidence levels within Australia, affecting the currency's strength. Additionally, the upcoming testimony from Federal Reserve officials and other USD-related economic data, such as the NFIB Small Business Index, will significantly impact the US dollar. Statements from Federal Reserve members can provide insights into future monetary policy, influencing the USD and, consequently, the AUD/USD forecast today.


Price Action:
The AUD/USD H4 chart is displaying an uptrend characterized by higher highs and higher lows. The price has been moving within an ascending channel, currently consolidating near the upper boundary. This indicates that the bullish momentum of the "Aussie" is still intact, but the pair is facing some resistance. The price action of the pair suggests a potential breakout above the current resistance levels if the bullish pressure persists.


Key Technical Indicators:


Ichimoku Cloud:

The price is trading above the Kumo (cloud), indicating a bullish trend. The Senkou Span A is above Senkou Span B, further supporting the bullish sentiment.

RSI (Relative Strength Index):
The RSI is currently at 58.79, which is in the bullish territory but not overbought. This suggests there is still room for the price to move higher.

Stochastic Oscillator:
The Stochastic (5, 3, 3) is at 21.83, indicating that the pair might be oversold in the short term, potentially leading to a reversal or continuation of the bullish trend if it crosses above 20.


Support and Resistance:

Support Levels:

The nearest support level is at 0.67126, followed by a more substantial support at 0.66892.

Resistance Levels:
The immediate resistance level is at 0.67355, with a significant resistance level at 0.67515, which aligns with the upper boundary of the ascending channel.


Conclusion and Consideration:
The AUD/USD technical analysis today shows the pair's strong bullish trend on the H4 chart, supported by the Ichimoku cloud analysis and the current position of the RSI. The Stochastic indicator suggests potential short-term oversold conditions, which might lead to a continuation of the bullish trend if the pair finds support at current levels. Traders should monitor key support and resistance levels, especially the 0.67355 and 0.67515 resistance levels, for potential breakout opportunities. Given the upcoming economic data releases and speeches from Federal Reserve officials, traders should remain cautious and employ proper risk management strategies.


Disclaimer: The provided analysis is for informational purposes only and does not constitute investment advice. Traders should conduct their own research and analysis before making any trading decisions.


FXGlory
07.09.2024


FXGLORY.gif
 
AUD/USD H4 Technical and Fundamental Analysis for 07.16.2024


AUDUSDH4.jpg


Time Zone: GMT +3
Time Frame: 4 Hours (H4)


Fundamental Analysis:

The AUD/USD forecast today is shaped by the economic health and policy decisions in both the United States and Australia. For the US, today's data releases include Building Permits and Housing Starts, both crucial indicators of the housing market's strength. Additionally, the Industrial Production m/m and Capacity Utilization Rate are key economic indicators to watch. Statements from FOMC Members Barkin and Waller, as well as the release of the Beige Book, will provide insights into the Fed's economic outlook and potential policy changes. Crude Oil Inventories will also be monitored, given their influence on market sentiment and the broader economy.


Price Action:
The AUD/USD H4 chart shows a mixed sentiment, with the price recently breaking below a significant support zone. Despite this, the pair has maintained a series of higher highs and higher lows, indicating a still-bullish trend overall. However, the recent break suggests potential for a trend reversal. Traders should closely monitor the price action for further signals of a change in trend.


Key Technical Indicators:

RSI (Relative Strength Index):

The RSI is currently at 46.54, slightly below the neutral 50 level, indicating weakening bullish momentum. This supports the potential for further bearish moves unless the RSI rebounds above 50.

MACD (Moving Average Convergence Divergence):
The MACD histogram is negative, with the MACD line below the signal line. This bearish crossover confirms the downside risk indicated by the price action and Parabolic SAR.


Support and Resistance:

Support Levels:

The nearest support is at 0.6600, with additional support at 0.6550. These levels are crucial for maintaining the broader uptrend.

Resistance Levels:
The pair is facing resistance at 0.6700, with stronger resistance at 0.6750. A break above these levels could signal a continuation of the bullish trend.


Conclusion and Consideration:
The AUD/USD H4 chart presents mixed signals, with the recent price action and technical indicators suggesting a potential trend reversal. The Parabolic SAR and MACD indicate bearish momentum, while the overall trend remains bullish. Traders should watch key support and resistance levels closely for potential breakouts or further bearish developments. Fundamental news releases for both the US and Australia will be crucial in influencing market sentiment and price direction. Monitoring these developments can provide valuable insights for trading decisions.


Disclaimer: The provided analysis is for informational purposes only and does not constitute investment advice. Traders should conduct their own research and analysis before making any trading decisions.


FXGlory
07.17.2024

image_2024-02-15_07_27_41.gif
 
AUDUSD H4 Technical and Fundamental Analysis for 15.08.2024


l_and_Fundamental_Analysis_for_08_15_2024-1024x524.jpg


Time Zone: GMT +3
Time Frame: 4 Hours (H4)


Fundamental Analysis:

The AUD/USD news analysis today is influenced by several key fundamental factors, these economic data are released from both Australia and the United States, most of the time leading to increased volatility in the pair commonly known as the "Aussie". Australia's economic health, particularly in areas such as employment, inflation, and consumer spending, plays a crucial role in determining the strength of the Australian Dollar. On the other hand, the US Dollar is affected by economic indicators like retail sales, jobless claims, and manufacturing indexes. Given the interconnectedness of the global economy, shifts in US monetary policy, particularly interest rate decisions by the Federal Reserve, have a significant impact on the AUD/USD exchange rate. The upcoming economic data for the US, such as retail sales and unemployment claims, are likely to drive the pair's market sentiment and could affect the Aussie's forecast.


Price Action:
The AUD/USD H4 chart, shows a steady uptrend after a prolonged downtrend, as indicated by the price movements above the Ichimoku Cloud. The pair's price action suggests that the pair is currently in a consolidation phase, with potential for continued bullish momentum. The price has recently bounced from a key support level and is now trading within a rising channel. The Aussie is facing resistance near the upper boundary of this channel, and a breakout above this level could signal a continuation of the uptrend.


Key Technical Indicators:
Ichimoku Cloud:
The AUD/USD price is trending above the Ichimoku Cloud, indicating its bullish market environment. The cloud itself acts as a support zone, and the price's position above it suggests that the uptrend is still intact. However, the flat Kijun-Sen line might indicate some hesitation or consolidation in the near term.
RSI (Relative Strength Index): The RSI is hovering around 50, which is a neutral zone, suggesting that the market is not overbought or oversold. This level indicates that there is room for further price movement in either direction, but the current consolidation phase might lead to a continuation of the existing trend if the RSI begins to rise.
MACD (Moving Average Convergence Divergence): The MACD line is above the signal line, with a positive histogram, indicating that bullish momentum is still present. The increasing distance between the MACD line and the signal line suggests that the upward movement could continue if the current trend persists.


Support and Resistance:
Support Levels:
The first support is located at 0.6596, which is the lower boundary of the rising channel and close to the Ichimoku Cloud. The next significant support level is at 0.6516, aligning with a previous swing low and the bottom of the cloud.
Resistance Levels: Immediate resistance is at 0.6640, which is the upper boundary of the rising channel. A breakout above this level could see the price move towards the next resistance at 0.6680, which coincides with a previous high.


Conclusion and Consideration:
The AUD/USD technical analysis today is showing signs of a potential continuation of the Aussie's bullish trend, supported by the positive signals from the Ichimoku Cloud, MACD, and the price's position within the rising channel. The RSI indicates that the market is currently in a neutral state, allowing for further price movement in either direction. Traders should monitor the upcoming US economic data releases, as these could influence the strength of the USD and impact the AUD/USD fundamental outlook. A breakout above the 0.6640 resistance level could signal a continuation of the uptrend, while a drop below the 0.6596 support could indicate a potential reversal or deeper consolidation.


Disclaimer: The provided analysis is for informational purposes only and does not constitute investment advice. Traders should conduct their own research and analysis before making any trading decisions.


FXGlory
15.08.2024


FXGLORY.gif
 
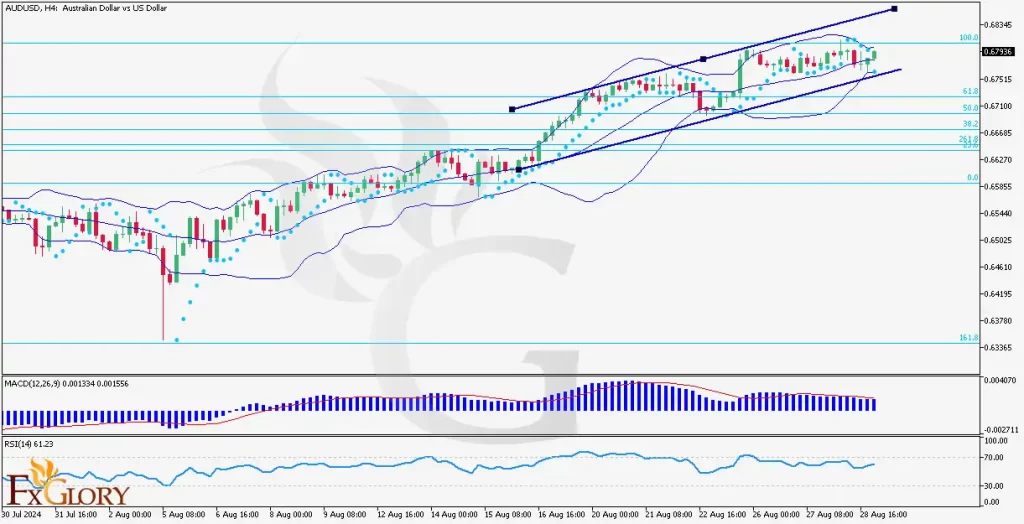
AUDUSD H4 Technical and Fundamental Analysis for 08.29.2024


AUDUSDH4-Technical-Analysis-08.-29.2024--1024x524.webp


Time Zone: GMT
Time Frame: 4 Hours (H4)


Fundamental Analysis:

The Australian Dollar (AUD) against the US Dollar (USD) is experiencing potential volatility due to key economic events scheduled today. In the US, the market will closely watch Raphael Bostic's speech at the Federal Reserve Bank of Atlanta, where his comments may provide insights into future monetary policy directions, affecting the USD's strength. Moreover, important data releases like the GDP Second Release and Unemployment Claims are expected, which can offer clues about the US economy's health and labor market. On the AUD side, no major economic releases are scheduled for today, which may keep the currency influenced primarily by external factors, especially from the USD.


Price Action:
The AUDUSD forex pair is showing a bullish trend on the H4 chart. The pair is trading within an ascending channel, with the recent candles moving towards the upper boundary. The last two candlesticks have shown positive movement, with the most recent candle being bullish, indicating sustained upward momentum. The AUD/USD price is currently moving between the 61.8% and 100% Fibonacci retracement levels, edging closer to the 100% mark. This suggests a strong upward bias, with the potential to test higher resistance levels.


Key Technical Indicators:
Bollinger Bands:
The Bollinger Bands have tightened, indicating reduced volatility and a potential buildup for a breakout. The price has been trading in the upper half of the bands and is now near the upper band, suggesting that the bullish momentum is still intact. This position implies a higher probability of further upward movement in the AUD USD price. However, traders should watch for any signs of reversal as the price approaches the upper band limit.
MACD (Moving Average Convergence Divergence): The MACD line is positioned above the signal line, and the histogram is showing positive but decreasing momentum. This indicates that while the bullish trend persists, the strength behind the movement is diminishing. Forex traders should watch for any potential crossover, which could signal a shift in momentum and a possible price correction in the AUD/USD pair.
RSI (Relative Strength Index): The RSI is currently at 61.23, which is below the overbought threshold of 70. This suggests that there is still room for upward movement before the AUD-USD reaches overbought conditions. The RSI supports the ongoing bullish trend and indicates that the market is not overly stretched.
Parabolic SAR: The Parabolic SAR dots have shifted below the price, indicating a bullish trend. This shift supports the upward movement, with the dots acting as potential support levels. As long as the Parabolic SAR remains below the price, the bullish bias in the AUD USD is likely to continue.


Support and Resistance Levels:
Support:
The immediate support is at the 61.8% Fibonacci level, around 0.67100, followed by stronger support near 0.66865, which aligns with the 50% retracement level.
Resistance: The primary resistance is at the 100% Fibonacci retracement level, approximately 0.68345. If the price breaks above this level, the next target could be the upper boundary of the ascending channel.


Conclusion and Consideration:
The AUDUSD pair on the H4 chart shows continued bullish momentum, underpinned by positive price action and supported by the technical indicators like Bollinger Bands, MACD, RSI, and Parabolic SAR. While the trend remains upward, caution is advised due to the tightening Bollinger Bands and the decreasing momentum shown by the MACD histogram. Upcoming economic events and data releases, especially from the US, could introduce volatility and influence price movements. Traders should monitor these developments closely and consider employing risk management strategies to navigate potential market fluctuations.


Disclaimer: This AUDUSD analysis is for informational purposes only and does not constitute investment advice. Traders should conduct their own research and analysis before making any trading decisions. Market conditions can change rapidly, and it is essential to stay updated with the latest information.


FXGlory
08.29.2024


FXGLORY.gif
 
AUDUSD H4 Technical and Fundamental Analysis for 09.18.2024


AUDUSDfor9.18.png


Time Zone: GMT +3
Time Frame: 4 Hours (H4)


Fundamental Analysis:


Upcoming economic data releases from the US and Australia are significant for understanding potential movements in the AUD/USD pair. From the US, the focus is on the Federal Funds Rate, which is expected to increase from 5.25% to 5.50%. Such a hike could strengthen the USD as higher interest rates usually attract foreign capital. Additionally, the FOMC Economic Projections and Statement will provide deeper insights into future monetary policy, which could sway market sentiment significantly. The TIC Long-Term Purchases, indicating foreign investments, jumped from 54.9B to an expected 96.1B, reflecting a robust interest in US financial assets.

From Australia, the Employment Change is set to show a sharp rise from 26.4K to 58.2K, suggesting strong job market conditions, which could bolster the AUD. The Unemployment Rate is projected to hold steady at 4.2%, supporting a stable economic outlook in Australia.


Price Action:

The AUD/USD price shows a consolidation above the Ichimoku cloud on the H4 chart, indicating a bullish sentiment in the near term. The RSI is above 50 but not yet in the overbought territory, suggesting there is room for upward movement without immediate reversal risks. The Stochastic indicator hints at the end of a bearish phase, potentially signaling an upcoming bullish crossover.


Key Technical Indicators:

RSI:
Hovering above 50,ing towards potential upward movements.

Stochastic: Indicating the exhaustion of bearish momentum with a possible bullish turn ahead.

Ichimoku Cloud: The price residing above the cloud supports bullish dominance, suggesting potential further upsides.


Support and Resistance:

Support Levels:
The nearest support level is found just above the lower boundary of the Ichimoku cloud at 0.6600. A drop below this level could lead to further bearish corrections towards 0.6550.

Resistance Levels: Immediate resistance is observed at the downward trend line from the recent correction phase. A decisive breakout above 0.6750 could reaffirm the bullish trend, aiming for the next resistance at 0.6800.


Conclusion and Consideration:

The AUD/USD H4 chart points to a bullish continuation as long as the price remains above the Ichimoku cloud. The anticipated breakout above the current descending trend line could usher in renewed bullish momentum. Traders should closely monitor the forthcoming economic data from both the US and Australia, as these will likely drive short-term price action and confirm or adjust the current bullish outlook.


Disclaimer: The provided analysis is for informational purposes only and does not constitute investment advice. Traders should conduct their own research and analysis before making any trading decisions.

FXGlory
09.18.2024


FXGLORY.gif
 
AUDUSD H4 Technical and Fundamental Analysis for 09.24.2024


audusdH4-1024x524.webp


Time Zone: GMT +3
Time Frame: 4 Hours (H4)


Fundamental Analysis:

The AUD/USD pair is currently influenced by critical economic events. Earlier today, the Reserve Bank of Australia (RBA) maintained its cash rate at 4.35%, which was anticipated by the market, accompanied by the RBA Rate Statement and subsequent Press Conference. These factors are crucial in shaping the Australian dollar's direction against United States’ Dollar. The RBA’s stance was seen as relatively neutral, keeping future rate hikes uncertain. Meanwhile, on the USD side, significant events like the upcoming FOMC member Bowman’s speech and data releases, such as the S&P/CS Composite-20 HPI y/y (5.9%, below the expected 6.5%) and the CB Consumer Confidence report, are likely to weigh on the US dollar’s performance. With the U.S. data releases showing mixed results, traders are closely monitoring the market for any clues on future Fed policy moves.


Price Action:
The AUD/USD H4 chart today shows a correction following a bullish rally. The price has now moved lower, testing a key support zone, indicating a consolidation phase. The Bollinger Bands show a sharp decline in volatility, with the price touching the lower band, suggesting the potential for a short-term bounce. However, the pair remains under pressure as both fundamental and technical factors point to a cautious sentiment. If AUD/USD breaks below current support, further downside may be expected, while holding above could see the pair attempt a recovery.


Key Technical Indicators:
Bollinger Bands:
The price is currently hugging the lower Bollinger Band, indicating a possible oversold condition in the short term. A contraction in the bands suggests lower volatility, signaling that a breakout might be imminent.
MACD (Moving Average Convergence Divergence): The MACD is in bearish territory, with the MACD line below the signal line. The histogram is also below zero, supporting the bearish outlook. This indicates a potential for further downside if momentum doesn't shift soon.
DeM (DeMarker Indicator): The DeMarker indicator is currently reading at 0.334, signaling that the pair may be in an oversold condition, which could indicate a short-term bullish reversal if buyers step in at current levels.


Support and Resistance:
Support Levels:
The immediate support is at 1.35000, aligning with a key psychological level. A stronger support level is noted at 1.34610, which coincides with a previous low from earlier sessions.
Resistance Levels: The nearest resistance is at 1.35700, which aligns with the middle of the Bollinger Bands and prior consolidation. The next significant resistance is around 1.36050, which marks the upper boundary of the recent price action.


Conclusion and Consideration:
The AUD/USD technical analysis suggests a cautious outlook as the pair consolidates within the lower Bollinger Band range, signaling potential short-term downside pressure. However, oversold conditions on both the DeM and Bollinger Bands suggest a possible rebound if key support holds. Traders should monitor the MACD for confirmation of continued bearish momentum or potential reversal on AUDUSD price chart. Additionally, economic events like the RBA Press Conference and upcoming U.S. data releases could add volatility to the pair. In this uncertain market environment, prudent risk management is advised, with close attention paid to the 1.35000 support and 1.35700 resistance levels for any breakout signals.


Disclaimer: The provided analysis is for informational purposes only and does not constitute investment advice. Traders should conduct their own research and analysis before making any trading decisions.


FXGlory
09.24.2024


FXGLORY.gif
 
AUDUSD H4 Technical and Fundamental Analysis for 10.07.2024


AUDUSD_H4_Chart_Daily_Technical_and_Fundamental_Analysis_for_10.jpg


Time Zone: GMT +3
Time Frame: 4 Hours (H4)


Fundamental Analysis:

The AUD/USD forex trading pair, also known as the “Aussie”, continues to experience significant movements, as the pair’s fundamental forecast is influenced by various factors impacting both the Australian and US economies. Recently, US Federal Reserve officials, including Michelle Bowman and Neel Kashkari, have provided hawkish views regarding the US economy and future interest rate hikes. These statements are strengthening the USD, putting downward pressure on the Australian dollar. Moreover, a US Consumer Credit report is anticipated, which may further support the USD if consumer debt levels exceed expectations. In Australia, markets are adjusting to the observance of Labor Day in some states, contributing to lower liquidity and increased volatility. On the economic front, Melbourne Institute data on consumer price inflation is also relevant, as it could signal future adjustments in Australian monetary policy, especially given the RBA’s focus on inflation control.


Price Action:
the AUD/USD H4 candle chart, shows the pair is trending downward within a well-defined bearish channel, having failed to break the upper resistance around 0.6840. The pair is currently trading near 0.6794, approaching a significant support level of 0.6770. The Aussi’s price action shows a clear pattern of lower highs and lower lows, confirming its bearish market sentiment. Buyers are attempting to regain control, but the prevailing market momentum suggests that the downtrend is still dominant.


Key Technical Indicators:
Bollinger Bands:
The price is currently close to the lower Bollinger Band, which may act as a short-term dynamic support. The bands are widening, indicating increasing volatility in the market. A breakdown below the lower band could signify continued AUDUSD bearish pressure, while a bounce might suggest a temporary reversal or consolidation.

MACD (Moving Average Convergence Divergence): The MACD line has crossed below the signal line, with the histogram showing a growing negative divergence. This suggests that the bearish momentum is still intact, and further downside is likely unless there is a strong reversal in the coming sessions.


Support and Resistance:
Support Levels:
The immediate support is at 0.6770, which aligns with recent price action and the lower Bollinger Band. If this level breaks, the next major support could be found around 0.6700, a key psychological level.

Resistance Levels: The closest resistance is at 0.6840, near the middle Bollinger Band. A successful breach above this level would suggest a potential recovery, but strong resistance is expected at the 0.6885 level.


Conclusion and Consideration:
The AUD/USD technical analysis today shows the ongoing bearish trend, supported by strong downward momentum in both the pair’s price action and its technical indicators. The widening Bollinger Bands and bearish MACD signal suggest that the pair may face further downward pressure, especially if the 0.6770 support level is breached. However, traders should be cautious of any potential rebounds from the lower Bollinger Band or support levels, which may trigger short-term corrections. The upcoming US economic data and Australian inflation reports could further influence the AUDUSD market direction. Given the current market conditions, employing risk management strategies, such as stop-loss orders, is crucial in navigating this volatile environment.


Disclaimer: The provided analysis is for informational purposes only and does not constitute investment advice. Traders should conduct their own research and analysis before making any trading decisions.


FXGlory
10.07.2024

FXGLORY.gif
 
Last edited:
AUDUSD H4 Technical and Fundamental Analysis for 10.17.2024


l_and_Fundamentan_Analysis_for_10_17_2024-1024x524.webp


Time Zone: GMT +3
Time Frame: 4 Hours (H4)


Fundamental Analysis:

The AUD/USD news analysis today is influenced by a variety of economic factors from both Australia and the United States. Recently, Australia's employment data and unemployment rate have been pivotal in shaping the Australian dollar's strength. A better-than-expected increase in job creation typically bolsters the AUD, as it signals a healthy economy and boosts consumer spending. On the other hand, the US dollar is being driven by various data points, including retail sales, jobless claims, and consumer sentiment. Hawkish statements from the Federal Reserve could lend support to the USD, while dovish tones or weak economic data would likely weaken it. Overall, both currencies in the AUD/USD pair, also known as the “Aussie”, are highly reactive to economic releases, with traders paying close attention to employment and inflation data to gauge future interest rate changes.


Price Action:
The AUD/USD H4 chart shows the pair’s clear bearish trend, with prices moving lower and making lower highs. The pair is currently trading around 0.66813, as evidenced by a series of red candles, signaling sustained selling pressure. There is a consistent downward momentum as the AUD/USD price remains below the Ichimoku cloud, indicating its bearish market sentiment. Key support levels are being tested, and the Aussie’s price action suggests a potential continuation of the downward trend if sellers maintain control.


Key Technical Indicators:
Ichimoku Cloud:
The price is trading below the Ichimoku cloud, which confirms a bearish trend in the market. The cloud itself is showing a wide span, indicating strong resistance overhead. The conversion line (Tenkan-sen) is below the baseline (Kijun-sen), reinforcing the downward bias.
MACD: The MACD histogram shows continued AUDUSD bearish momentum, with the MACD line trading below the signal line. This suggests that the selling pressure is likely to persist, and there’s little sign of a bullish reversal in the short term.


Support and Resistance:
Support Levels:
The immediate support level is at 0.66600, followed by 0.66370. These levels could provide a floor for the price in the short term if the selling pressure eases.
Resistance Levels: Key resistance is seen at 0.66930, with stronger resistance at 0.67300. Any upside movement would likely face challenges at these levels due to the broader bearish trend.


Conclusion and Consideration:
In summary, the AUD/USD forecast today tells us that the pair is experiencing bearish momentum as shown by both the Ichimoku and MACD indicators. Given the ongoing pressure, traders should be cautious of potential further downside, particularly if key support levels break. However, should upcoming economic data from Australia, such as employment figures, surprise to the upside, the pair could see a retracement toward the resistance levels. It is critical for traders to stay updated with the latest economic data and central bank announcements to better anticipate potential shifts in the AUDUSD pair’s direction.


Disclaimer: The provided analysis is for informational purposes only and does not constitute investment advice. Traders should conduct their own research and analysis before making any trading decisions.


FXGlory
10.17.2024


FXGLORY-Crypto - Discount - .gif
 
Back
Top Bottom