FXGlory Ltd
Well-known member
AUDUSD analysis 02.11.2023

Time Zone: GMT +2
Time Frame: 4 Hours (H4)
Fundamental Analysis:
The AUD/USD currency pair represents the exchange rate between the Australian Dollar and the US Dollar. Key drivers of this pair are monetary policy decisions from the Reserve Bank of Australia (RBA) and the Federal Reserve. Additionally, economic indicators from both countries, such as employment figures, GDP data, and commodity prices, play crucial roles, especially given Australia's dependency on commodity exports. Traders should continuously monitor these factors to grasp a clearer view of the pair's potential direction.
Price Action:
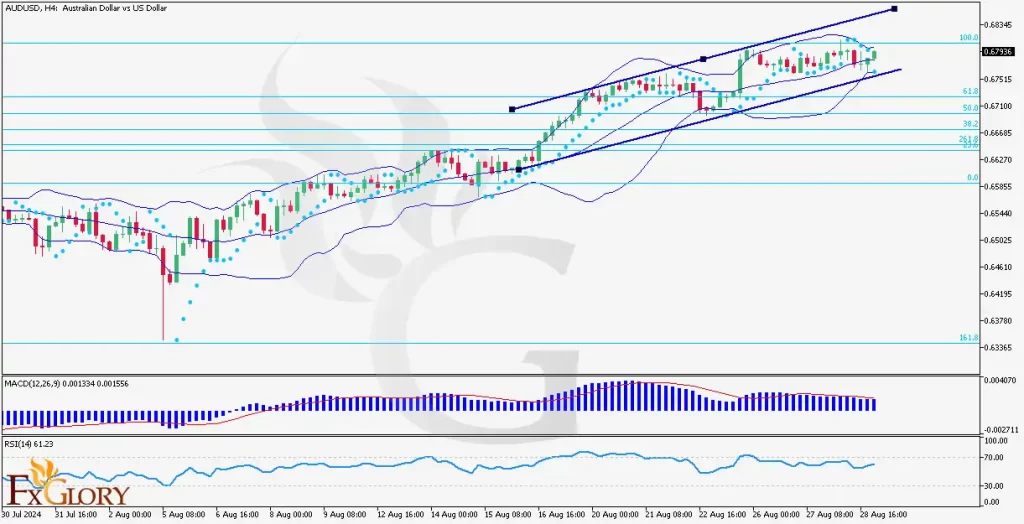
The H4 chart for AUD/USD displays alternating bullish and bearish trends. The most recent price movement demonstrates a notable bullish push, suggesting that buyers have gained some momentum in this timeframe.
Key Technical Indicators:
Bollinger Bands: Prices have moved within the Bollinger Bands, indicating periodic volatility. The central moving average has served as both support and resistance, providing dynamic points of interest.
RSI (Relative Strength Index): The RSI, positioned at approximately 68.10, is nearing the overbought threshold. This suggests potential over-extension and a possible retracement.
Parabolic SAR: The recent placement of the dots below the price suggests a bullish trend. However, traders should be watchful as the Parabolic SAR can quickly switch, indicating trend reversals.
Volumes: Visible volume bars show varying buying and selling activity. A heightened volume during an uptrend implies a strong bullish sentiment, while increased volume during downtrends might suggest a bearish sentiment.
Support and Resistance:
Resistance: The 0.65050 zone is evident as an immediate resistance for the pair.
Support: The 0.62850 region acts as a significant support level, with the price respecting this area on multiple occasions.
Conclusion and Consideration:
The AUD/USD pair on the H4 timeframe reveals a slightly bullish inclination due to recent upward price movements. The nearing overbought condition signaled by the RSI suggests caution and the possibility of a minor pullback. The Parabolic SAR currently supports this bullish sentiment, but its dynamic nature means traders should remain vigilant. Defining trades around the identified support and resistance, and blending technical insights with fundamental data from Australia and the US, will furnish traders with a more holistic perspective on market trends.
Note: We do not suggest any investment advice, and these analyses are just to increase the traders' awareness but not a certain instruction for trading.
FXGlory
02.11.2023
Last edited:

