• Attention Forex Brokers, FX Companies & Hedge Funds.

    forum.forex is available for Acquisition

    Enquire

Daily Market Forecast By Capitalcore

USDJPY bearish trend continues on H4 chart

USD/JPY forex pair, also known as the "Gopher," is one of the most traded forex pairs globally, reflecting the relationship between the U.S. dollar and the Japanese yen. The pair is highly sensitive to market sentiment, risk appetite, and economic developments in both the U.S. and Japan. Today’s economic landscape is shaped by the upcoming release of the New York Manufacturing Index from the U.S., which serves as a leading indicator of economic health. If the actual index is higher than forecasted, it will support the dollar, signaling improving business conditions. However, due to the closure of Japanese banks for Respect-for-the-Aged Day, market liquidity could be low, leading to irregular volatility and a higher influence of speculators.
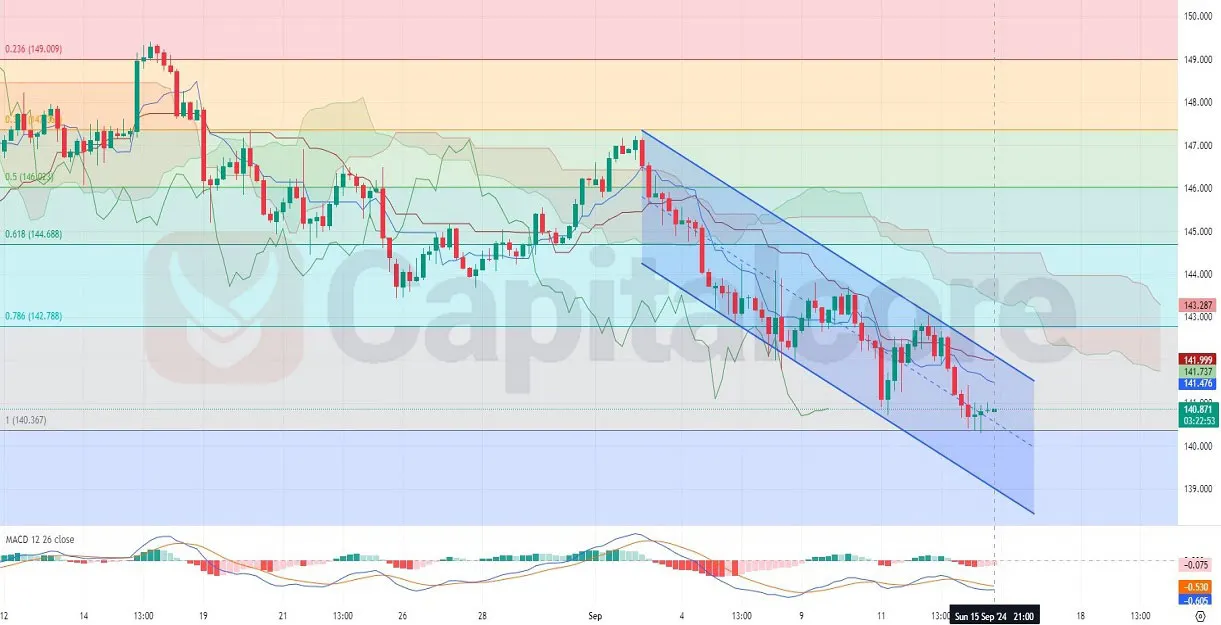
H4-USDJPY-Technical-And-Fundamental_Analysis-on-09-16-2024.webp

Chart Notes:
• Chart time-zone is UTC (+03:00)
• Candles’ time-frame is 4h.

Analyzing the USD/JPY H4 chart, the price is currently trading below the Ichimoku cloud, indicating bearish momentum. The cloud has widened, suggesting the potential for a stronger downtrend, though the last four candles show a slight bullish correction. The price is fluctuating between the 0.786 and 1 Fibonacci levels, having corrected slightly after touching the 1 level. The MACD shows a weak bullish divergence, but the histogram remains negative, signaling that any bullish momentum may be short-lived. Overall, the trend remains bearish, and further declines are expected after this minor correction.

• DISCLAIMER: Please note that the above analysis is not an investment suggestion by “Capitalcore LLC”. This post has been published only for educational purposes.

Capitalcore
 
USDCAD H4 chart technical overview today

The USDCAD forex pair, often referred to as the "Loonie," is a popular currency pair that represents the exchange rate between the US Dollar (USD) and the Canadian Dollar (CAD). As a commodity-based currency, the Canadian Dollar is closely tied to oil prices, while the US Dollar's strength is influenced by macroeconomic factors. The upcoming CAD news, especially from Statistics Canada and CMHC regarding housing starts and consumer price indexes, is expected to drive volatility, especially since inflation and construction are key economic indicators.
From a fundamental perspective, the Canadian Dollar could strengthen today if housing starts data and inflation reports exceed forecasts, signaling a robust economy. On the USD side, traders will focus on retail sales and manufacturing production figures, which are key to gauging US consumer demand and inflationary pressure. If US data underperforms while Canadian data impresses, this may tilt the USDCAD pair toward further CAD gains.
H4-USDCAD-Technical-Analysis-on-09-17-2024.webp

Chart Notes:
• Chart time-zone is UTC (+03:00)
• Candles’ time-frame is 4h.

Analyzing the USDCAD H4 chart, several technical indicators provide insights. The price has been in a slightly bullish trend, consolidating within the upper half of the Bollinger Bands, indicating upward momentum. The MACD histogram is showing a positive divergence, suggesting slight bullish pressure. The price is currently between the 0.236 and 0 Fibonacci retracement levels, hinting at potential resistance. However, if the bullish candles continue to dominate, a breakout above the 0.236 Fib level could push the pair higher.

• DISCLAIMER: Please note that the above analysis is not an investment suggestion by “Capitalcore LLC”. This post has been published only for educational purposes.

Capitalcore
 
USD/CAD Current Market Overview
USD/CAD, also known as the “Loonie,” reflects the exchange rate between the U.S. dollar and the Canadian dollar. The pair has recently shown signs of bullish momentum, but this trend is beginning to lose steam, as evidenced in the latest price action. The chart displays a gradually weakening upward slope, suggesting that buyers might be losing control. Today, both the U.S. and Canadian economies are expected to release significant data, including U.S. housing starts and the Federal Reserve’s statement on interest rates, which could cause volatility. Additionally, the Bank of Canada (BoC) is expected to release the Summary of Deliberations, adding more potential for movement in the pair.
9-18.jpg

Chart Notes:
• Chart time-zone is UTC (+03:00)
• Candles’ time-frame is 4h.

Technically, the Relative Strength Index (RSI) has broken out of its bullish structure, indicating a possible shift toward bearish sentiment. Meanwhile, the Moving Average Convergence Divergence (MACD) is showing signs of a bearish wave potentially forming, with the MACD line approaching the signal line from above. Given the fundamental backdrop, including crude oil inventory reports, interest rate decisions, and projections, these indicators suggest caution for traders as a potential downturn may follow in the coming sessions.

• DISCLAIMER: Please note that the above analysis is not an investment suggestion by “Capitalcore Ltd”. This post has been published only for educational purposes.

Capitalcore
 
GBPUSD H4 Chart Indicators Outlook and Forecast

The GBPUSD forex pair, often referred to as "Cable," is a major currency pair that represents the British Pound against the US Dollar. This pair is widely traded in the forex market, and its movements are influenced by economic factors from both the UK and the US. Traders keep a close eye on it, especially when significant economic data or central bank announcements are expected.
For today's fundamental outlook on Cable, the upcoming releases from the Bank of England are highly anticipated by traders. The central bank's hawkish stance is expected to positively impact the GBP, especially if the Monetary Policy Committee (MPC) members vote for an interest rate hike or lean toward tightening policies. Insights from the minutes of the MPC meeting and the inflation letter due to CPI fluctuations will provide critical clues about the UK's economic health. On the US side, Treasury International Capital (TIC) flows and Philadelphia Fed Business Outlook Survey may affect the dollar, especially if demand for domestic securities surges, or if manufacturers display confidence in business conditions. Both of these indicators are pivotal for USD valuations in the coming trading sessions.
H4-Technical-Analysis-on-GBPUSD-on-09-19-2024.webp

Chart Notes:
• Chart time-zone is UTC (+03:00)
• Candles’ time-frame is 4h.

In the Cable’s attached H4 chart, we can see a bullish trend for GBP/USD with a combination of both bearish and bullish candles, but the overall movement shows price appreciation. The Ichimoku Cloud, which acts as a dynamic support and resistance level, confirms the bullish outlook, with the price currently above the cloud. Furthermore, the pair trades between the 0.786 and 1 Fibonacci retracement levels, which signals potential resistance around the upper level. The MACD indicator shows a bullish divergence, with the histogram reflecting increasing buying momentum, suggesting the upward trend could continue. However, traders should remain cautious as minor corrections are still possible.

• DISCLAIMER: Please note that the above analysis is not an investment suggestion by “Capitalcore LLC”. This post has been published only for educational purposes.

Capitalcore
 
Back
Top Bottom