FXOpen Trader
Well-known member
GBP/USD Holding Uptrend Support, GBP/JPY Eyes Additional Gains

GBP/USD found support near 1.3825 and it is now showing positive signs. GBP/JPY is stable above 149.40 and it is now facing hurdles near 150.00.
Important Takeaways for GBP/USD and GBP/JPY
GBP/USD Technical Analysis
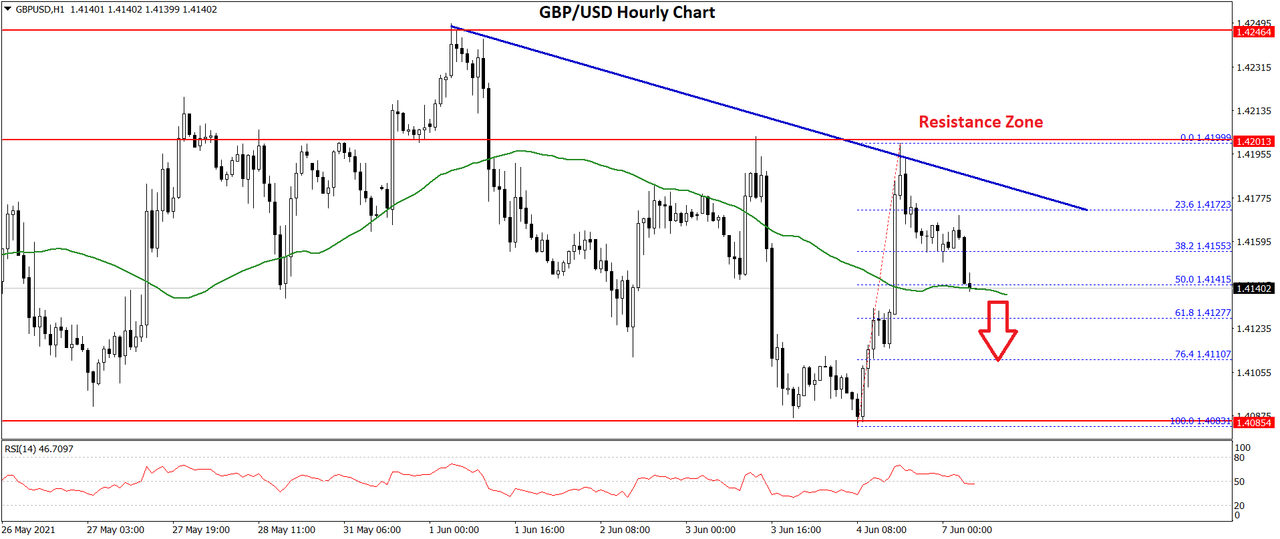
In the past few sessions, the British Pound saw a steady increase above the 1.4000 zone against the US Dollar. The GBP/USD pair broke the 1.4100 level and extended its upward move.
There was even a break above the 1.4200 resistance zone. A high was formed near 1.4233 on FXOpen and the pair is currently correcting gains. It broke the 1.4200 and 1.4180 support levels.

There was also a spike below the 1.4150 level and the 50 hourly simple moving average. A low is formed near 1.4136 and the pair is now consolidating. There is also a major bullish trend line forming with support near 1.4135 on the hourly chart of GBP/USD.
On the upside, an immediate resistance is near the 1.4160 level and the 50 hourly simple moving average. It is close to the 23.6% Fib retracement level of the recent decline from the 1.4233 high to 1.4136 low.
The first major resistance is near the 1.4185 level. The 50% Fib retracement level of the recent decline from the 1.4233 high to 1.4136 low is also near the 1.4185 level. Any more gains could set the pace for a strong rally above the 1.4200 level.
Conversely, the pair could break the trend line support and continue lower below 1.4135. The next major support is near the 1.4100 level. If there are additional losses, the pair could decline towards the 1.4000 level.
Read Full on FXOpen Company Blog...
GBP/USD found support near 1.3825 and it is now showing positive signs. GBP/JPY is stable above 149.40 and it is now facing hurdles near 150.00.
Important Takeaways for GBP/USD and GBP/JPY
- The British Pound extended its increase above the 1.4200 region against the US Dollar.
- There is a major bullish trend line forming with support near 1.4135 on the hourly chart of GBP/USD.
- GBP/JPY is correcting gains from the 155.00 resistance zone.
- There is a key bearish trend line forming with resistance near 154.40 on the hourly chart.
GBP/USD Technical Analysis
In the past few sessions, the British Pound saw a steady increase above the 1.4000 zone against the US Dollar. The GBP/USD pair broke the 1.4100 level and extended its upward move.
There was even a break above the 1.4200 resistance zone. A high was formed near 1.4233 on FXOpen and the pair is currently correcting gains. It broke the 1.4200 and 1.4180 support levels.
There was also a spike below the 1.4150 level and the 50 hourly simple moving average. A low is formed near 1.4136 and the pair is now consolidating. There is also a major bullish trend line forming with support near 1.4135 on the hourly chart of GBP/USD.
On the upside, an immediate resistance is near the 1.4160 level and the 50 hourly simple moving average. It is close to the 23.6% Fib retracement level of the recent decline from the 1.4233 high to 1.4136 low.
The first major resistance is near the 1.4185 level. The 50% Fib retracement level of the recent decline from the 1.4233 high to 1.4136 low is also near the 1.4185 level. Any more gains could set the pace for a strong rally above the 1.4200 level.
Conversely, the pair could break the trend line support and continue lower below 1.4135. The next major support is near the 1.4100 level. If there are additional losses, the pair could decline towards the 1.4000 level.
Read Full on FXOpen Company Blog...


