FXOpen Trader
Well-known member
AUD/USD and NZD/USD Remain At Risk of More Downsides

AUD/USD started a fresh decline from well above the 0.7550 level. NZD/USD also declined heavily and it even tested the 0.6920 support zone.
Important Takeaways for AUD/USD and NZD/USD
AUD/USD Technical Analysis
After struggling to clear the 0.7600 resistance, the Aussie Dollar started a major decline against the US Dollar. The AUD/USD pair broke the 0.7550 and 0.7520 support levels to move into a bearish zone.
The pair even broke the 0.7480 support and the 50 hourly simple moving average. It spiked below 0.7420 and traded as low as 0.7409 on FXOpen. It is now consolidating losses above the 0.7400 level.
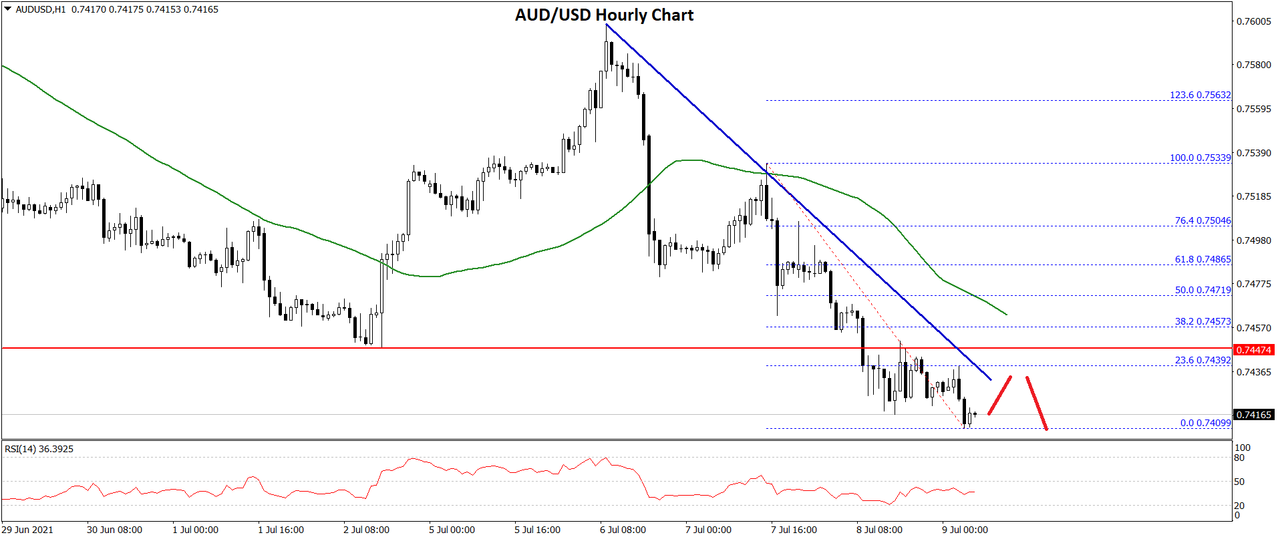
An immediate resistance is near the 0.7430 level. It is near the 23.6% Fib retracement level of the recent decline from the 0.7533 swing high to 0.7409 low. There is also a key bearish trend line forming with resistance near 0.7435 on the hourly chart of AUD/USD.
The next major resistance is near the 0.7465 level and the 50 hourly SMA. The 50% Fib retracement level of the recent decline from the 0.7533 swing high to 0.7409 low is also near the 0.7470 level.
To move into a positive zone, the pair must settle above 0.7470 and the 50 hourly SMA. An initial support on the downside is near the 0.7410 level. The next major support is near the 0.7400 level. If there is a downside break below the 0.7400 support, the pair could extend its decline towards the 0.7350 level.
Read Full on FXOpen Company Blog...
AUD/USD started a fresh decline from well above the 0.7550 level. NZD/USD also declined heavily and it even tested the 0.6920 support zone.
Important Takeaways for AUD/USD and NZD/USD
- The Aussie Dollar started a major decline after it failed to clear 0.7600 against the US Dollar.
- There is a key bearish trend line forming with resistance near 0.7435 on the hourly chart of AUD/USD.
- NZD/USD also started a major decline from well above the 0.7050 level.
- There is a major bearish trend line forming with resistance near 0.6975 on the hourly chart of NZD/USD.
AUD/USD Technical Analysis
After struggling to clear the 0.7600 resistance, the Aussie Dollar started a major decline against the US Dollar. The AUD/USD pair broke the 0.7550 and 0.7520 support levels to move into a bearish zone.
The pair even broke the 0.7480 support and the 50 hourly simple moving average. It spiked below 0.7420 and traded as low as 0.7409 on FXOpen. It is now consolidating losses above the 0.7400 level.

An immediate resistance is near the 0.7430 level. It is near the 23.6% Fib retracement level of the recent decline from the 0.7533 swing high to 0.7409 low. There is also a key bearish trend line forming with resistance near 0.7435 on the hourly chart of AUD/USD.
The next major resistance is near the 0.7465 level and the 50 hourly SMA. The 50% Fib retracement level of the recent decline from the 0.7533 swing high to 0.7409 low is also near the 0.7470 level.
To move into a positive zone, the pair must settle above 0.7470 and the 50 hourly SMA. An initial support on the downside is near the 0.7410 level. The next major support is near the 0.7400 level. If there is a downside break below the 0.7400 support, the pair could extend its decline towards the 0.7350 level.
Read Full on FXOpen Company Blog...

