FXOpen Trader
Well-known member
GBP/USD Turns Green, USD/CAD Faces Hurdles
GBP/USD started a fresh increase and it broke the 1.3880 resistance. USD/CAD is recovering, but it is facing hurdles near 1.2520.
Important Takeaways for GBP/USD and USD/CAD
GBP/USD Technical Analysis
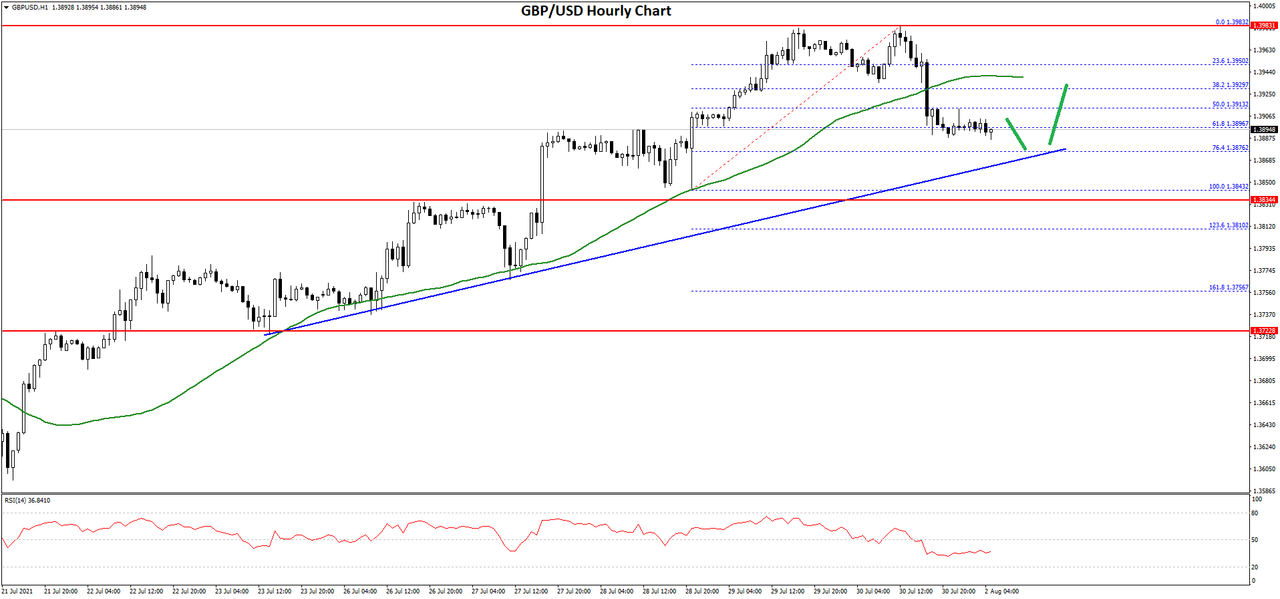
After forming a base above the 1.3620 level, the British Pound started a decent increase against the US Dollar. The GBP/USD pair broke the 1.3750 resistance level to move into a positive zone.
The bulls gained pace above the 1.3850 level and the 50 hourly simple moving average. The pair even broke the 1.3950 resistance level. A high was formed near 1.3981 on FXOpen and it is currently correcting lower.
There was a break below the 1.3950 support level. The pair traded below the 50% Fib retracement level of the recent move from the 1.3843 swing low to 1.3981 high.
On the downside, the first key support is near the 1.3875 area. There is also a key bullish trend line forming with support near 1.3875 on the hourly chart of GBP/USD. The trend line is close to the 76.4% Fib retracement level of the recent move from the 1.3843 swing low to 1.3981 high.
If there is a break below 1.3875 and 1.3860, the pair could decline towards the 1.3825 support zone. Any more losses might call for a test of the 1.3720 support.
On the upside, an initial resistance is near the 1.3940 level. The first major resistance is near the 1.3980 level. The main resistance is now near the 1.4000 zone, above which the pair is likely to accelerate higher towards the 1.4050 and 1.4100 levels.
Read Full on FXOpen Company Blog...

GBP/USD started a fresh increase and it broke the 1.3880 resistance. USD/CAD is recovering, but it is facing hurdles near 1.2520.
Important Takeaways for GBP/USD and USD/CAD
- The British Pound started a steady increase above the 1.3850 and 1.3880 resistance levels.
- There is a key bullish trend line forming with support near 1.3875 on the hourly chart of GBP/USD.
- USD/CAD started a steady decline below the 1.2550 and 1.2520 support levels.
- There was a break above a short-term declining channel with resistance near 1.2455 on the hourly chart.
GBP/USD Technical Analysis

After forming a base above the 1.3620 level, the British Pound started a decent increase against the US Dollar. The GBP/USD pair broke the 1.3750 resistance level to move into a positive zone.
The bulls gained pace above the 1.3850 level and the 50 hourly simple moving average. The pair even broke the 1.3950 resistance level. A high was formed near 1.3981 on FXOpen and it is currently correcting lower.
There was a break below the 1.3950 support level. The pair traded below the 50% Fib retracement level of the recent move from the 1.3843 swing low to 1.3981 high.
On the downside, the first key support is near the 1.3875 area. There is also a key bullish trend line forming with support near 1.3875 on the hourly chart of GBP/USD. The trend line is close to the 76.4% Fib retracement level of the recent move from the 1.3843 swing low to 1.3981 high.
If there is a break below 1.3875 and 1.3860, the pair could decline towards the 1.3825 support zone. Any more losses might call for a test of the 1.3720 support.
On the upside, an initial resistance is near the 1.3940 level. The first major resistance is near the 1.3980 level. The main resistance is now near the 1.4000 zone, above which the pair is likely to accelerate higher towards the 1.4050 and 1.4100 levels.
Read Full on FXOpen Company Blog...

